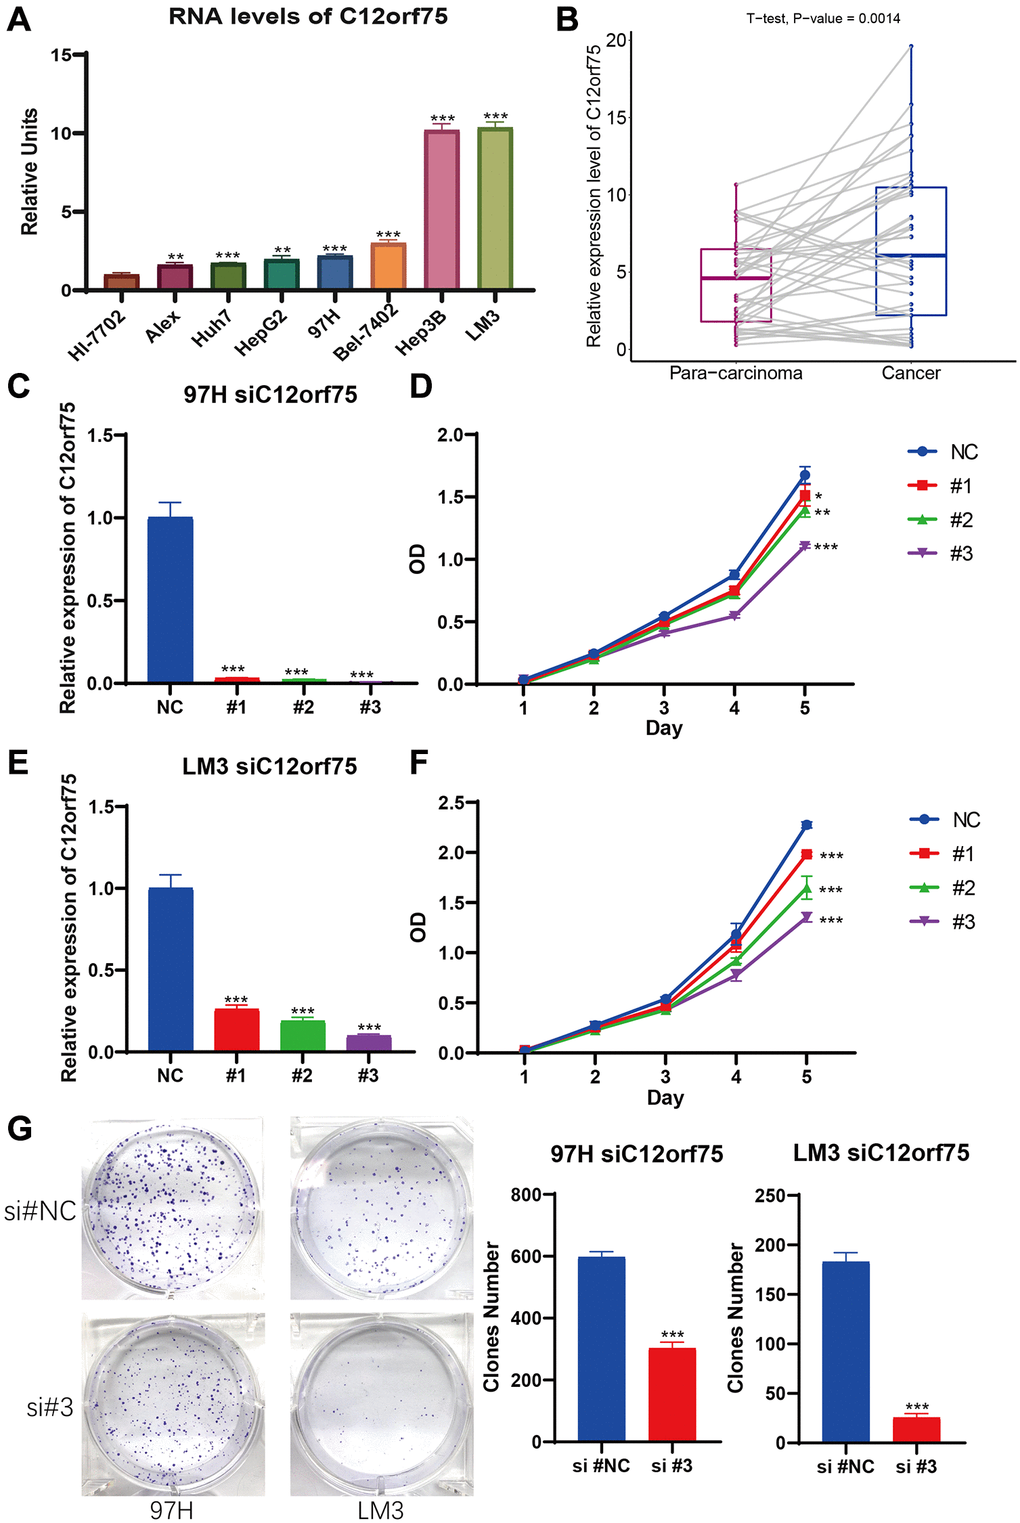
Figure 6.C12orf75 was the high expression in liver cancer cell lines and patient samples and knockdown C12orf75 suppresses LIHC proliferation. (A) Analysis of C12orf75 expression in HCC and normal liver cell lines. Compared to normal liver cell line HL-7702, C12orf75 was remarkably upregulated in several HCC cell lines: Alex, Huh7, HepG2, 97H, Bel-7402, Hep3B, and, LM3. Fold change = log2 ∆∆Ct, log2 ∆∆Ct = (CtGAPDH − Ct C12orf75) of test cell lines − (CtGAPDH − CtC12orf75) of Hl-7702. (B) Relative expression of C12orf75 in clinical HCC and adjacent liver tissues. C12orf75 expression was significantly higher in HCC tissues than that in adjacent liver tissues (p = 0.002, number of patients = 20). (C) RT-PCR was used to detect the efficiency of knockdown for C12orf75 in 97H. (D) 97H were treated with siRNA against C12orf75 for 24 hours and then subjected to the CCK-8 assay. (E) RT-PCR was used to detect the efficiency of knockdown for C12orf75 in LM3. (F) LM3 were treated with siRNA against C12orf75 for 24 hours and then subjected to the CCK-8 assay. (G) 97H and LM3 were treated with siRNA against C12orf75 for 24 hours and then subjected to the colony formation assay. *p < 0.05; **p < 0.01; ***p < 0.001.