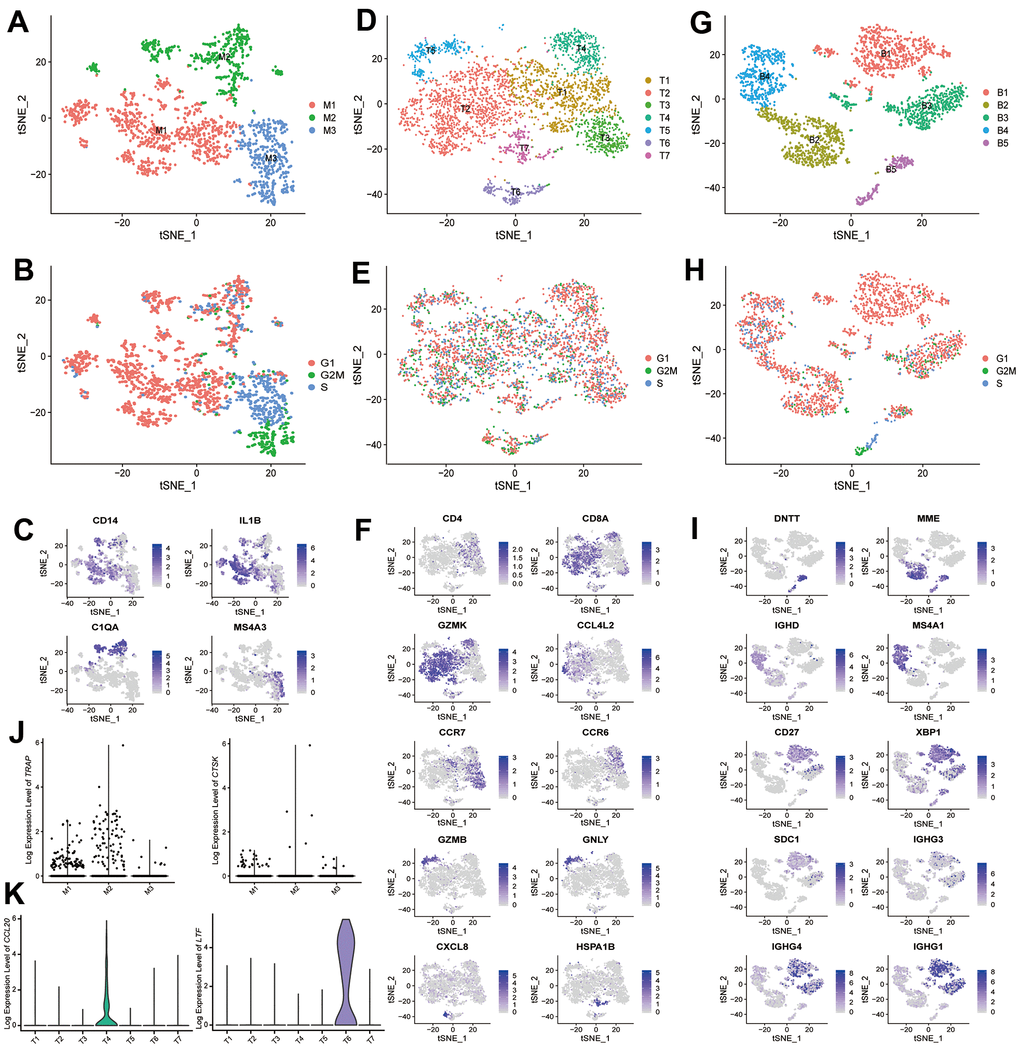
Figure 3.scRNA-seq analysis reveals different cell subtypes in monocytes, T cells and B cells. (A) t-SNE plot shows the color-coded clustering for monocytes. Monocytes: M1-M3. (B) t-SNE plot shows the cell cycle status of monocytes. (C) Monocyte subtypes signature genes, embedded on t-SNE dimension reduction map, and colored by gene expression levels. (D) t-SNE plot shows the color-coded clustering for T cells. T cells: T1-T7. (E) t-SNE plot shows the cell cycle status of T cells. (F) T cell subtypes signature genes, embedded on t-SNE dimension reduction map, and colored by gene expression levels. (G) t-SNE plot shows the color-coded clustering for B cells. B cells: B1-B5. (H) t-SNE plot shows the cell cycle status of B cells. (I) B cell subtypes signature genes, embedded on t-SNE dimension reduction map, and colored by gene expression levels. (J) The expression level of TRAP (left) and CTSK (right) in monocytes subtypes. (K) The expression level of CCL20 (left) and LTF (right) in T cells subtypes.