


Introduction
Compared with other tissues in the body, bone is a relatively dynamic organ, which undergoes significant turnover during life [1]. The coupling and precise regulation between bone cells affect the homeostasis of bone metabolism, including bone formation by osteoblast, bone resorption by osteoclast and regulation by osteocyte [2, 3]. In addition, bone microenvironment is a complex system containing various other types of cells, such as stromal cell, immune cells, endothelial cells, which also influence bone metabolism via complex crosstalks [4]. For instance, monocytes can regulate bone remodeling by secretion of various cytokines, such as bone morphogenetic protein 2 (BMP2), which in turn promote the osteogenic differentiation by mesenchymal stem/stromal cells [5]. Resting T cells have a protective role of bone [6], while activated T cells increase the production of receptor activator of NF-kappaB ligand (RANKL) and tumor necrosis factor alpha (TNF-α) to promote osteoclast formation and subsequent bone loss under inflammatory conditions [7]. B cells can regulate osteoclastogenesis by expressing osteoclast differentiation factor (ODF)/RANKL [8]. However, current strategies for bone study are based on whole cell population of bone by bulk sequencing of al the cells for bone tissue [9, 10]. The approach ignores the heterogeneity between individual cells and lack the accuracy and resolution to characterize regulation and crosstalks between bone tissue cells.
Single-cell RNA sequencing (scRNA-seq) provides an opportunity to explore the heterogeneity of complex tissues and cell-to-cell interactions at high resolution [11, 12]. Although flow cytometry is a prominent technique for categorizing cells, which can identify the single cell through the expression of both cell surface and (or) intracellular proteins, it has been limited to probing a few selected proteins [13, 14]. Similarly, magnetic activated cell sorting (MACS) and immunohistochemistry (IHC) also have this limitation. And in situ hybridization (ISH) has been limited to probing a few selected RNAs. These single-cell approaches can only focus on information of the selected RNAs or proteins [13], while scRNA-seq can provide a broad characterization of the transcriptome profile. Besides, compared with the traditional bulk-RNA sequencing, scRNA-seq provides information of cellular biology at higher resolution and with more accuracy [15]. scRNA-seq has been successfully applied to reveal the transcriptional diversity of murine bone marrow-derived mesenchymal stem cells (BM-MSCs) [16], and to identify differential expression genes (DEGs) between human Wharton's jelly stem cells and human BM-MSCs [17]. However, the cellular composition of bone tissue cells and the crosstalks between them at single-cell resolution remains unknown.
Here, we applied scRNA-seq technology to characterize cellular heterogeneity at single-cell level in freshly isolated bone tissue cells from human femoral head. We identified serine protease 23 (PRSS23) and matrix remodeling associated protein 8 (MXRA8) as novel bone metabolism-related genes. Moreover, we defined distinct subtypes of monocytes, T and B cells in bone microenvironment. We further discussed their relationship with bone metabolism and re-constructed the communication networks of cells in human femoral head. We believe that the global single-cell profile of how different types of human femoral head tissue cells work together would promote our comprehensive understanding of bone metabolism, and provide some novel insights into the prevention and treatment of skeletal diseases, such as osteoporosis and osteoarthritis.
Results
scRNA-seq analysis reveals distinct cell types in human femoral head
We performed scRNA-seq analyses on femoral head tissue cells from four human subjects (Figure 1A). The gene expression profiles between samples have a strong correlation, suggesting that there is no obvious batch effect between samples (R > 0.96; Supplementary Figure 1). After merging of the four datasets and QC, we obtained a cell-gene matrix of 26,574 cells, with an average of 1035 genes detected per cell (Figure 1B). Then we clustered cells into 16 distinct clusters (Figure 1C), and identified the cluster-specific markers (Figure 1D).
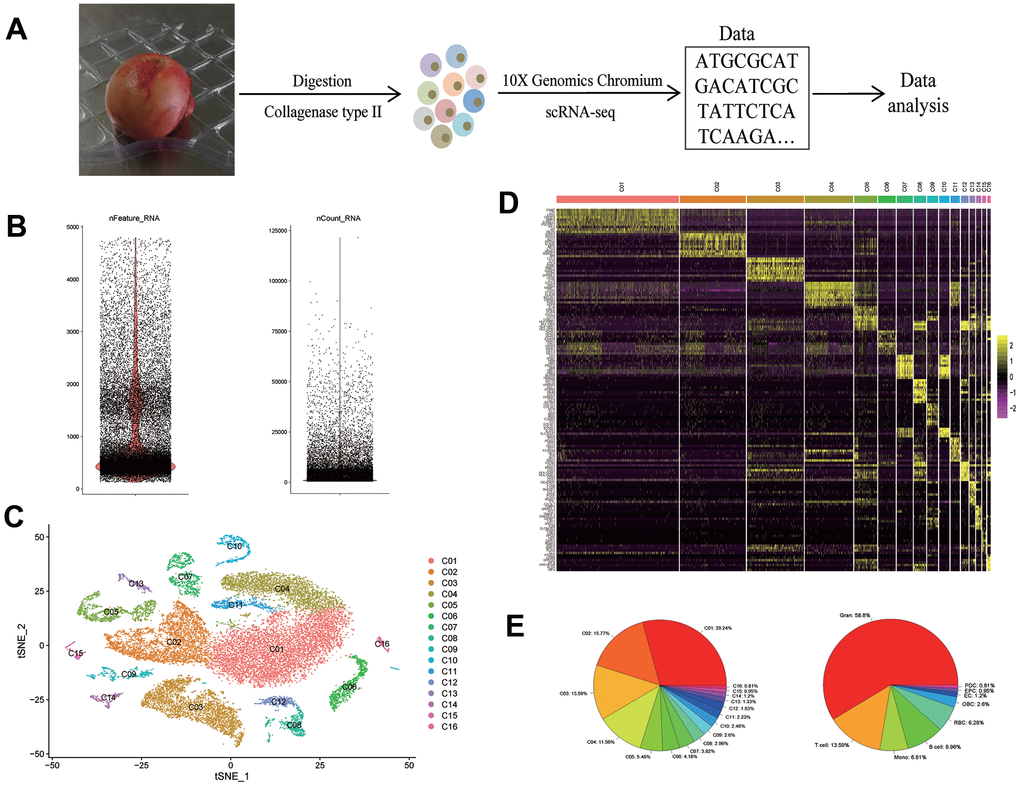
Figure 1. scRNA-seq reveals the cell populations of the human femoral head. (A) Study overview. (B) After QC, the number of genes (left) and RNA molecules (right). (C) t-SNE plot shows the color-coded clustering of human femoral head tissue cells. (D) Heat map shows the top 10 genes with the highest avg_logFC of each cluster. (E) The proportion of each cluster (left) and each cell type (right). scRNA-seq: single-cell RNA sequencing: Gran: granulocyte; Mono: monocyte; RBC: red blood cell; OBC: osteoblastic lineage cell; EC: endothelial cell; EPC: endothelial progenitor cell; PDC: plasmacytoid dendritic cell.
Among these clusters, we identified that, 1) clusters C01, C02, C04, C11 were CD11b+CD66b+ granulocytes; 2) cluster C03 was CD3+ T cells; 3) clusters C05 and C13 were CD14+ monocytes; 4) clusters C06, C08, C12 were CD19+CD79A+CD20+ B cells; 5) clusters C07 and C10 were CD235a+ red blood cells (RBCs); 6) cluster C09 was osteoblastic lineage cells; 7) cluster C14 was CD31+VWF+ endothelial cells (ECs); 8) cluster C15 was CD117+CD133+ endothelial progenitor cells (EPCs); 9) cluster C16 was GZMB+IL3RA+ plasmacytoid dendritic cells (PDCs). Proportions of each cluster and each cell type were shown in Figure 1E, respectively.
Functional analyses and hub genes identification for DEGs of osteoblastic lineage cells
The osteoblastic lineage cells were a complex cell population which contained BM-MSCs, osteoblasts, osteocytes and chondrocytes, and we showed the expression of cell-specific markers by the violin plot (Supplementary Figure 2A).
To further study the biological functions of osteoblastic lineage cells, we performed GO and KEGG enrichment analyses based on the DEGs of osteoblastic lineage cells (Supplementary Tables 2, 3). GO enrichment analysis identified abundant terms related to bone metabolism, such as “extracellular structure organization”, “extracellular matrix organization”, “establishment of protein localization to organelle”, “skeletal system development”, and “ossification” (Supplementary Figure 2B). Several signal pathways related to bone metabolism were revealed by KEGG enrichment analysis (Supplementary Figure 2B), such as “PI3K-Akt signaling pathway”, “Rap1 signaling pathway”, and “TGF-beta signaling pathway”.
To identify the hub genes, which are genes with a high degree of connectivity, in the DEGs of osteoblastic lineage cells, a PPI network of DEGs was constructed (Supplementary Figure 2C), and the top 20 hub genes with a high degree of connectivity were detected (Figure 2A). These top 20 hub genes were enriched in the process related to bone metabolism (Supplementary Table 4 and Supplementary Figure 2D), such as “extracellular structure organization”, “extracellular matrix organization”, “ossification”, “skeletal system development” and “osteoblast differentiation”. We also detect seven significant modules in the PPI network (Figure 2B and Supplementary Figure 2E, Supplementary Table 5). We used genes in the most significant module, module 1 (score = 19.097, with 32 nodes and 296 edges) for a GO enrichment analysis (Supplementary Figure 2D and Supplementary Table 6), and found that genes in module 1 were significantly related to extracellular structure, extracellular matrix, collagen fibril, ossification, skeletal system, etc. The biological process analysis of the top 16 genes in module 1 was shown in Supplementary Figure 2F.
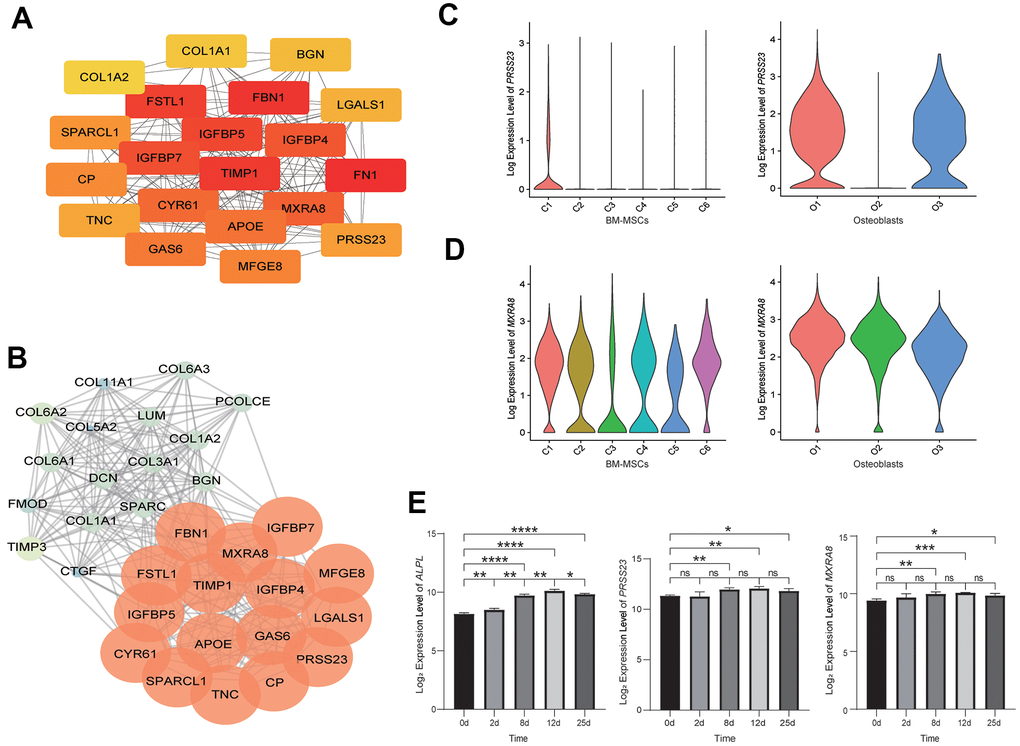
Figure 2. Analysis of osteoblastic lineage cells. (A) Gene network analysis of DEGs. The top 20 hub genes in the network. The color changes from yellow to red, indicating low to high connectivity. (B) The top MCODE-score module (module 1) screened from the PPI network. The color changes from blue to red, indicating low to high MCODE-score. (C) The expression level of PRSS23 in BM-MSCs (left) and osteoblasts (right). C1: osteoblast precursor; C2: adipocyte precursor; C3: terminal 1; C4: terminal 2; C5: contaminated; C6: chondrocyte precursor; O1: pre-osteoblast (early osteoblast); O2: mature osteoblast; O3: undetermined osteoblast (early osteoblast). (D) The expression level of MXRA8 in BM-MSCs (left) and osteoblasts (right). (E) The expression levels of alkaline phosphatase (ALPL), PRSS23 and MXRA8 during in vitro osteogenic differentiation from BM-MSCs (left to right). X-axis represents time (days) of induce differentiation and y-axis reflects log2-normalized gene expression levels. Stars indicate significance level of gene expression difference between two samples by t-test. ns, not significant; *, p value < 0.05; **, p value < 0.01; ***, p value < 0.001; ****, p value < 0.0001.
Among the hub genes in the DEGs network and the hub genes in the most significant module (module 1) of the PPI network, we found that most of these genes were known to be related to bone metabolism (Supplementary Table 7). However, two genes, PRSS23 and MXRA8, were rarely reported to regulate bone metabolism. In addition, PRSS23 was highly expressed in osteoblast precursors and early osteoblasts (pre-osteoblast and undetermined osteoblast) (Figure 2C), and MXRA8 was highly expressed in both BM-MSCs and osteoblasts (Figure 2D). During the process of osteogenic differentiation by BM-MSCs in vitro, the expression levels of PRSS23 and MXRA8 were significantly increased (Figure 2E). Therefore, we speculate that PRSS23 and MXRA8 may play important roles in bone metabolism.
scRNA-seq analysis reveals distinct subtypes in monocytes, T cells and B cells in human femoral head
To study the cellular heterogeneity of monocytes, T cells and B cells in bone tissue, we extracted 1,810 CD14+ monocytes, 3,612 CD3+ T cells and 2,382 CD19+CD79+CD20+ B cells from the original dataset for further analyses.
Among the monocytes (Figure 3A–3C), we identified three putative subtypes: IL1B+ monocytes (M1), C1QA+ monocytes (M2), and MS4A3+ granulocyte-monocyte progenitors (M3). In the T cells (Supplementary Figure 4D–4F), we identified one CD4 cluster (T1), and six CD8 clusters: GZMK+CCL4L2+ T cells (T2), CCR7+ T cells (T3), GZMK+CCR6+ T cells (T4), GZMB+GNLY+ T cells (T5), GZMK+CXCL8+ T cells (T6), and GZMK+HSPA1A+ T cells (T7). Within the B cells (Figure 3G–3I), we identified DNTT+/MME+ pre-B cell (B2 and B5), MSHA1+ mature/activated B cell (B4), CD27+ memory B cell (B3), and a plasmablast cluster (B1) with high expression of immunoglobulin genes and XBP1 (a transcription factor for plasma cell differentiation) [18].
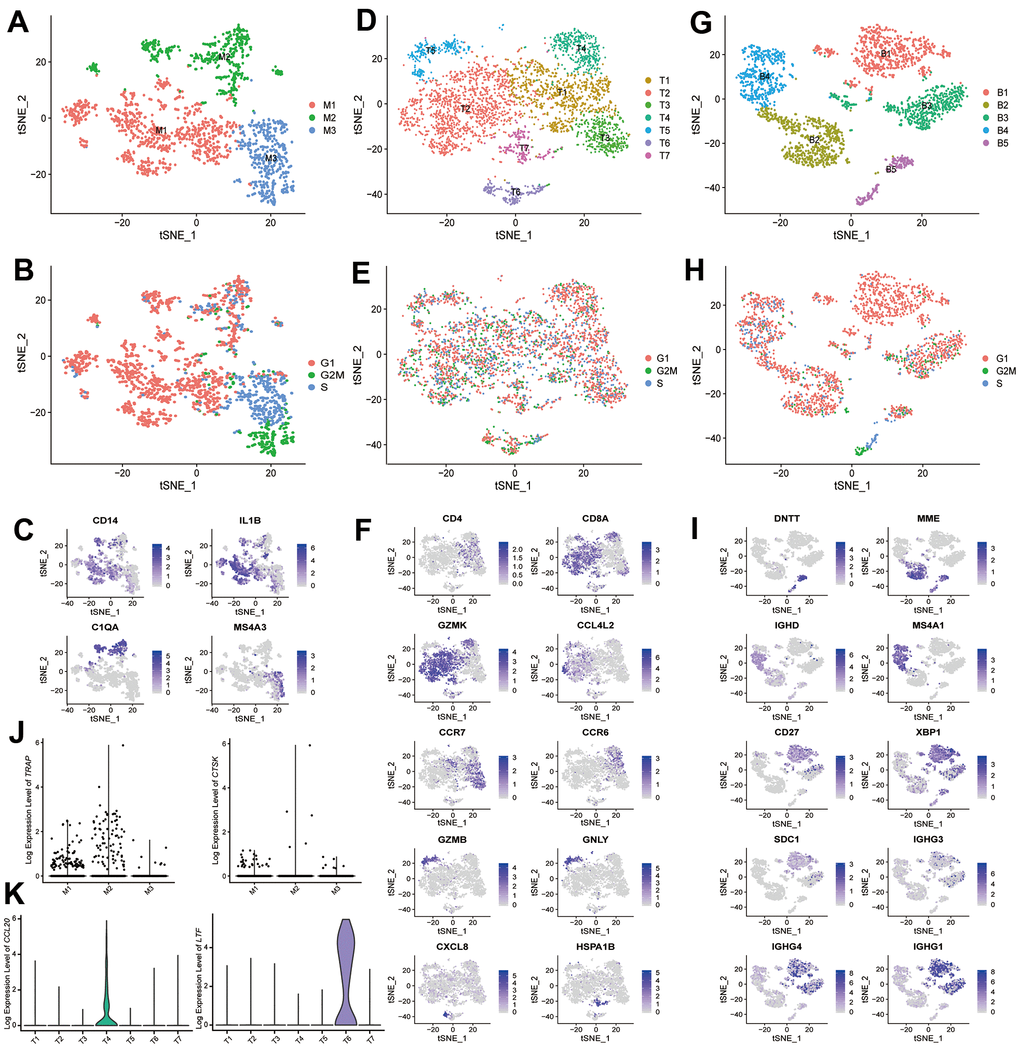
Figure 3. scRNA-seq analysis reveals different cell subtypes in monocytes, T cells and B cells. (A) t-SNE plot shows the color-coded clustering for monocytes. Monocytes: M1-M3. (B) t-SNE plot shows the cell cycle status of monocytes. (C) Monocyte subtypes signature genes, embedded on t-SNE dimension reduction map, and colored by gene expression levels. (D) t-SNE plot shows the color-coded clustering for T cells. T cells: T1-T7. (E) t-SNE plot shows the cell cycle status of T cells. (F) T cell subtypes signature genes, embedded on t-SNE dimension reduction map, and colored by gene expression levels. (G) t-SNE plot shows the color-coded clustering for B cells. B cells: B1-B5. (H) t-SNE plot shows the cell cycle status of B cells. (I) B cell subtypes signature genes, embedded on t-SNE dimension reduction map, and colored by gene expression levels. (J) The expression level of TRAP (left) and CTSK (right) in monocytes subtypes. (K) The expression level of CCL20 (left) and LTF (right) in T cells subtypes.
GO and KEGG enrichment analyses suggested that several of these subtypes were involved in the regulation of bone metabolism (Table 1 and Figures 4–7 and Supplementary Tables 8–13), including IL1B+ monocytes (M1), CD4 T cells (T1), GZMK+CCL4L2+ T cells (T2), GZMK+CCR6+ T cells (T4), GZMB+GNLY+ T cells (T5), GZMK+CXCL8+ T cells (T6), DNTT+/MME+ pre-B cell (only B5), and MSHA1+ mature/activated B cell (B4).
Table 1. Enrichment analysis of subtypes in monocytes, T cells and B cells.
| Subtype | ID | Description | GeneRatio | p.adjust | Gene symbol | ||||||||||||||||||||||||||||||||||||||||||||||||||||||||||||||||||||||||||||||||||||||||||||||
| M1 | GO:0001503 | ossification | 19/399 | 0.011 | VCAN, ATP2B1, PTGS2, FGR, CTNNB1, TGFB1, H3F3A, HIF1A, AREG, TCIRG1, CEBPB, DDX5, DDX21, TPM4, SNAI1, IL6R, JUNB, CLEC5A, IL6 | ||||||||||||||||||||||||||||||||||||||||||||||||||||||||||||||||||||||||||||||||||||||||||||||
| GO:0001649 | osteoblast differentiation | 14/399 | 0.006 | VCAN, CTNNB1, H3F3A, AREG, TCIRG1, CEBPB, DDX5, DDX21, TPM4, SNAI1, IL6R, JUNB, CLEC5A, IL6 | |||||||||||||||||||||||||||||||||||||||||||||||||||||||||||||||||||||||||||||||||||||||||||||||
| GO:0030316 | osteoclast differentiation | 10/399 | 0.001 | LILRB3, FCER1G, CTNNB1, MAFB, TGFB1, OSCAR, TCIRG1, CEBPB, ANXA2, JUNB | |||||||||||||||||||||||||||||||||||||||||||||||||||||||||||||||||||||||||||||||||||||||||||||||
| GO:0045453 | bone resorption | 5/399 | 0.045 | CTNNB1, ADAM8, TNFAIP3, TCIRG1, IL6 | |||||||||||||||||||||||||||||||||||||||||||||||||||||||||||||||||||||||||||||||||||||||||||||||
| GO:0046849 | bone remodeling | 6/399 | 0.048 | CTNNB1, TGFB1, ADAM8, TNFAIP3, TCIRG1, IL6 | |||||||||||||||||||||||||||||||||||||||||||||||||||||||||||||||||||||||||||||||||||||||||||||||
| hsa04380 | osteoclast differentiation | 19/238 | 0.000 | IL1B, NCF2, LILRB2, LILRA5, LILRB3, FOSL2, NFKBIA, SOCS3, TGFB1, IFNGR2, LCP2, OSCAR, NFKB2, NCF1, NFKB1, IFNGR1, IL1A, FYN, JUNB | |||||||||||||||||||||||||||||||||||||||||||||||||||||||||||||||||||||||||||||||||||||||||||||||
| T1 | GO:0030316 | osteoclast differentiation | 4/62 | 0.007 | GPR183, JUNB, FOS, FOXP1 | ||||||||||||||||||||||||||||||||||||||||||||||||||||||||||||||||||||||||||||||||||||||||||||||
| T2 | GO:0030316 | osteoclast differentiation | 6/191 | 0.008 | PIK3R1, CD81, CCL3, IFNG, GNAS, TGFB1 | ||||||||||||||||||||||||||||||||||||||||||||||||||||||||||||||||||||||||||||||||||||||||||||||
| GO:0045670 | regulation of osteoclast differentiation | 4/191 | 0.046 | PIK3R1, CCL3, IFNG, GNAS | |||||||||||||||||||||||||||||||||||||||||||||||||||||||||||||||||||||||||||||||||||||||||||||||
| T4 | GO:0030316 | osteoclast differentiation | 4/109 | 0.037 | IL23R, CA2, GPR183, FOS | ||||||||||||||||||||||||||||||||||||||||||||||||||||||||||||||||||||||||||||||||||||||||||||||
| GO:0045672 | positive regulation of osteoclast differentiation | 3/109 | 0.010 | IL23R, CA2, FOS | |||||||||||||||||||||||||||||||||||||||||||||||||||||||||||||||||||||||||||||||||||||||||||||||
| T5 | GO:0030316 | osteoclast differentiation | 6/308 | 0.043 | TYROBP, FCER1G, TGFB1, CCL3, CD81, CEBPB | ||||||||||||||||||||||||||||||||||||||||||||||||||||||||||||||||||||||||||||||||||||||||||||||
| GO:0045778 | positive regulation of ossification | 6/308 | 0.043 | TGFB1, IFITM1, CLIC1, ADRB2, ZBTB16, CEBPB | |||||||||||||||||||||||||||||||||||||||||||||||||||||||||||||||||||||||||||||||||||||||||||||||
| T6 | GO:0030316 | osteoclast differentiation | 7/246 | 0.007 | LTF, FCER1G, TYROBP, LILRB3, SNX10, MAPK14, FOS | ||||||||||||||||||||||||||||||||||||||||||||||||||||||||||||||||||||||||||||||||||||||||||||||
| B5 | GO:0001649 | osteoblast differentiation | 32/1647 | 0.042 | LEF1, CDK6, H3F3A, HNRNPC, SMAD1, CBFB, ID2, ID3, HNRNPU, ATP5F1B, RBMX, FBXO5, SYNCRIP, MEF2D, GNAS, SNRNP200, CLTC, ALYREF, REST, HDAC7, DHX9, DDX5, MEF2C, CLIC1, H3F3B, CTNNB1, ADAR, TPM4, RPS15, FBL, LIMD1, PHB | ||||||||||||||||||||||||||||||||||||||||||||||||||||||||||||||||||||||||||||||||||||||||||||||
| B4 | hsa04380 | osteoclast differentiation | 13/383 | 0.040 | JUNB, JUND, NFKB2, NFATC1, GRB2, TGFB1, FOS, FOSB, CYLD, PPP3CA, SOCS3, NCF1, NFKBIA | ||||||||||||||||||||||||||||||||||||||||||||||||||||||||||||||||||||||||||||||||||||||||||||||
| Monocytes: M1-M3; T cells: T1-T7; B cells: B1-B5. | |||||||||||||||||||||||||||||||||||||||||||||||||||||||||||||||||||||||||||||||||||||||||||||||||||
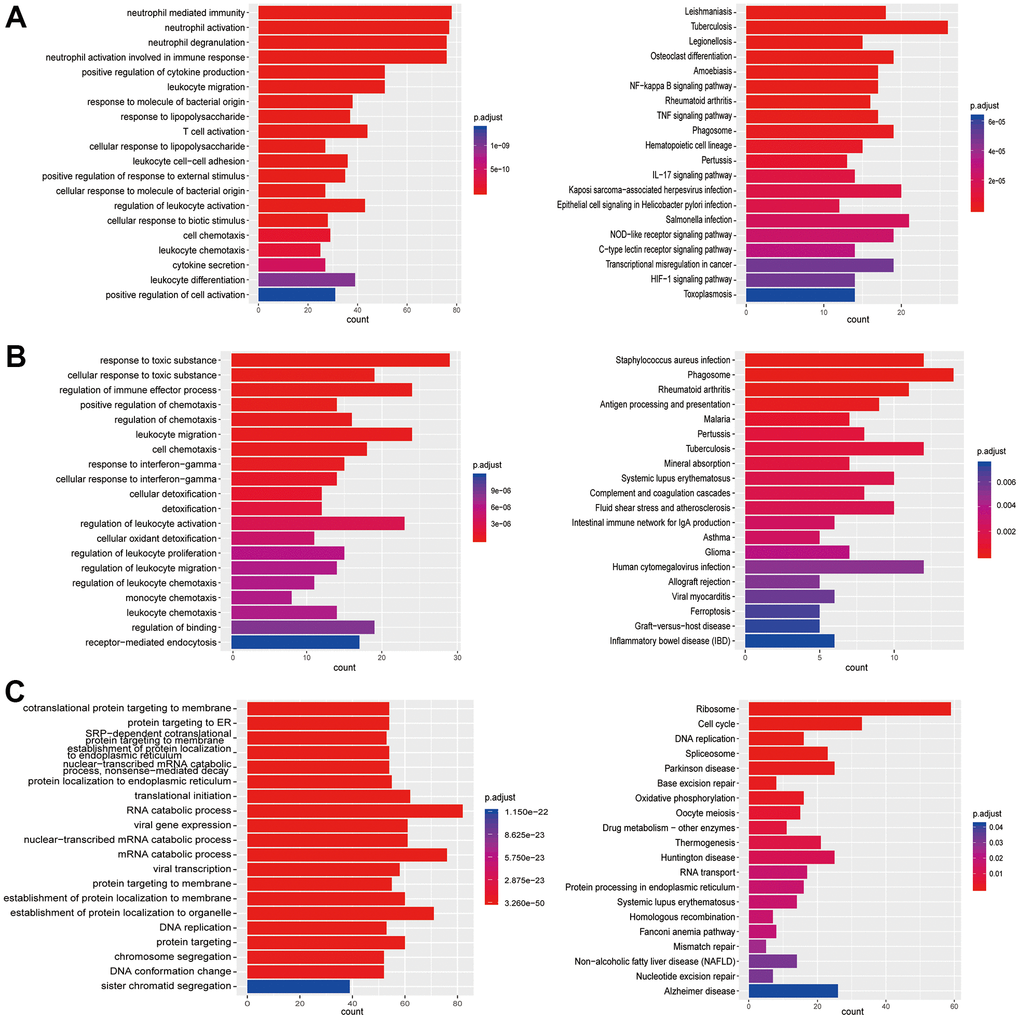
Figure 4. Enrichment analysis of subtypes in monocytes (M1-M3). (A) GO (left) and KEGG (right) enrichment analysis of DEGs in M1. (B) GO (left) and KEGG (right) enrichment analysis of DEGs in M2. (C) GO (left) and KEGG (right) enrichment analysis of DEGs in M3.
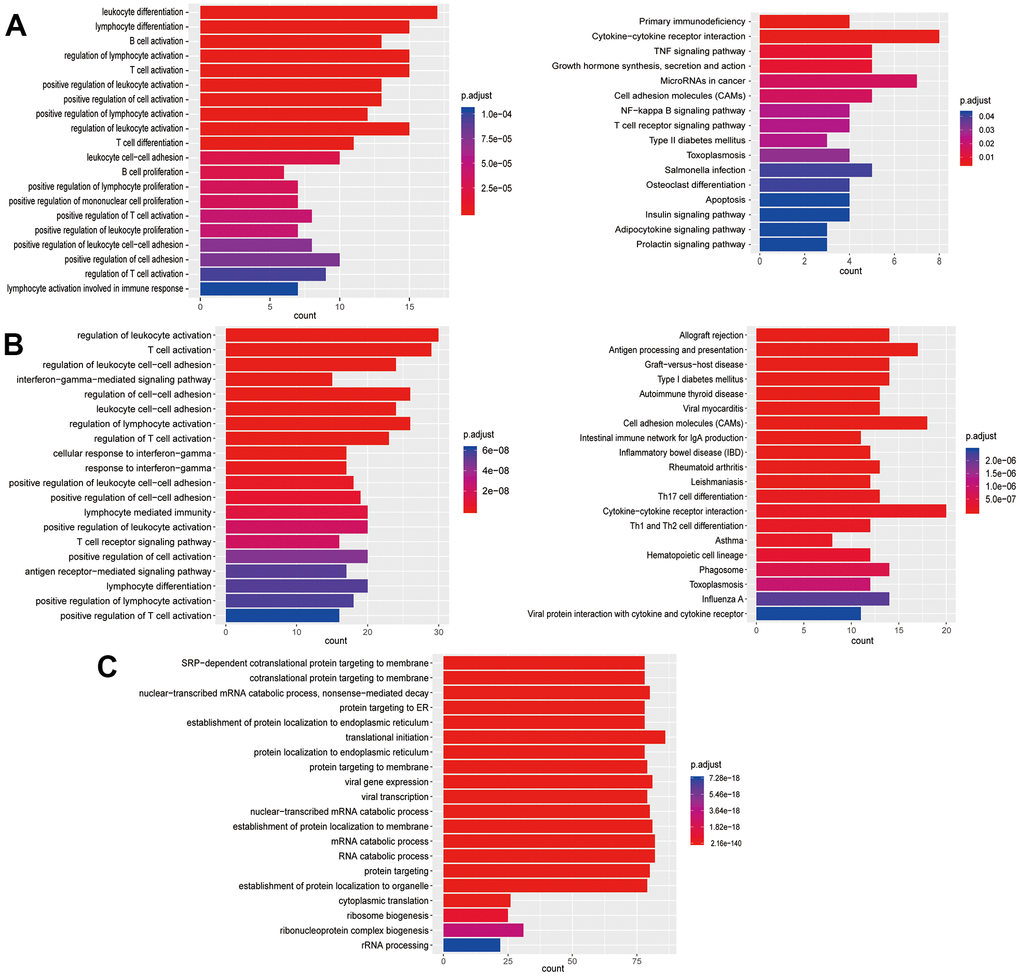
Figure 5. Enrichment analysis of subtypes in T cells (T1-T3). (A) GO (left) and KEGG (right) enrichment analysis of DEGs in T1. (B) GO (left) and KEGG (right) enrichment analysis of DEGs in T2. (C) GO enrichment analysis of DEGs in T3.
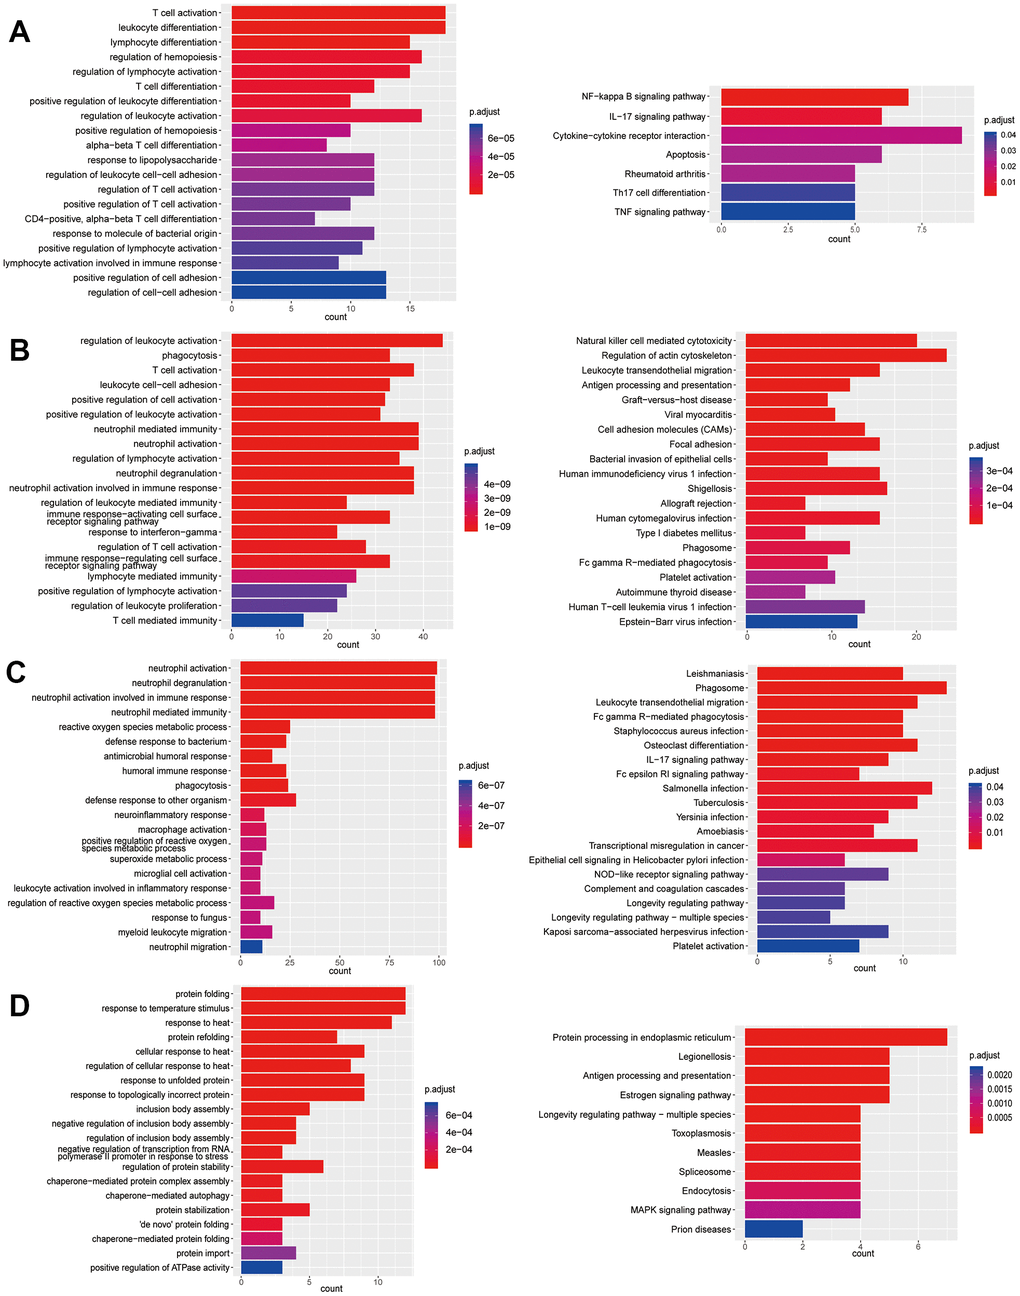
Figure 6. Enrichment analysis of subtypes in T cells (T4-T7). (A) GO (left) and KEGG (right) enrichment analysis of DEGs in T4. (B) GO (left) and KEGG (right) enrichment analysis of DEGs in T5. (C) GO (left) and KEGG (right) enrichment analysis of DEGs in T6. (D) GO (left) and KEGG (right) enrichment analysis of DEGs in T7.
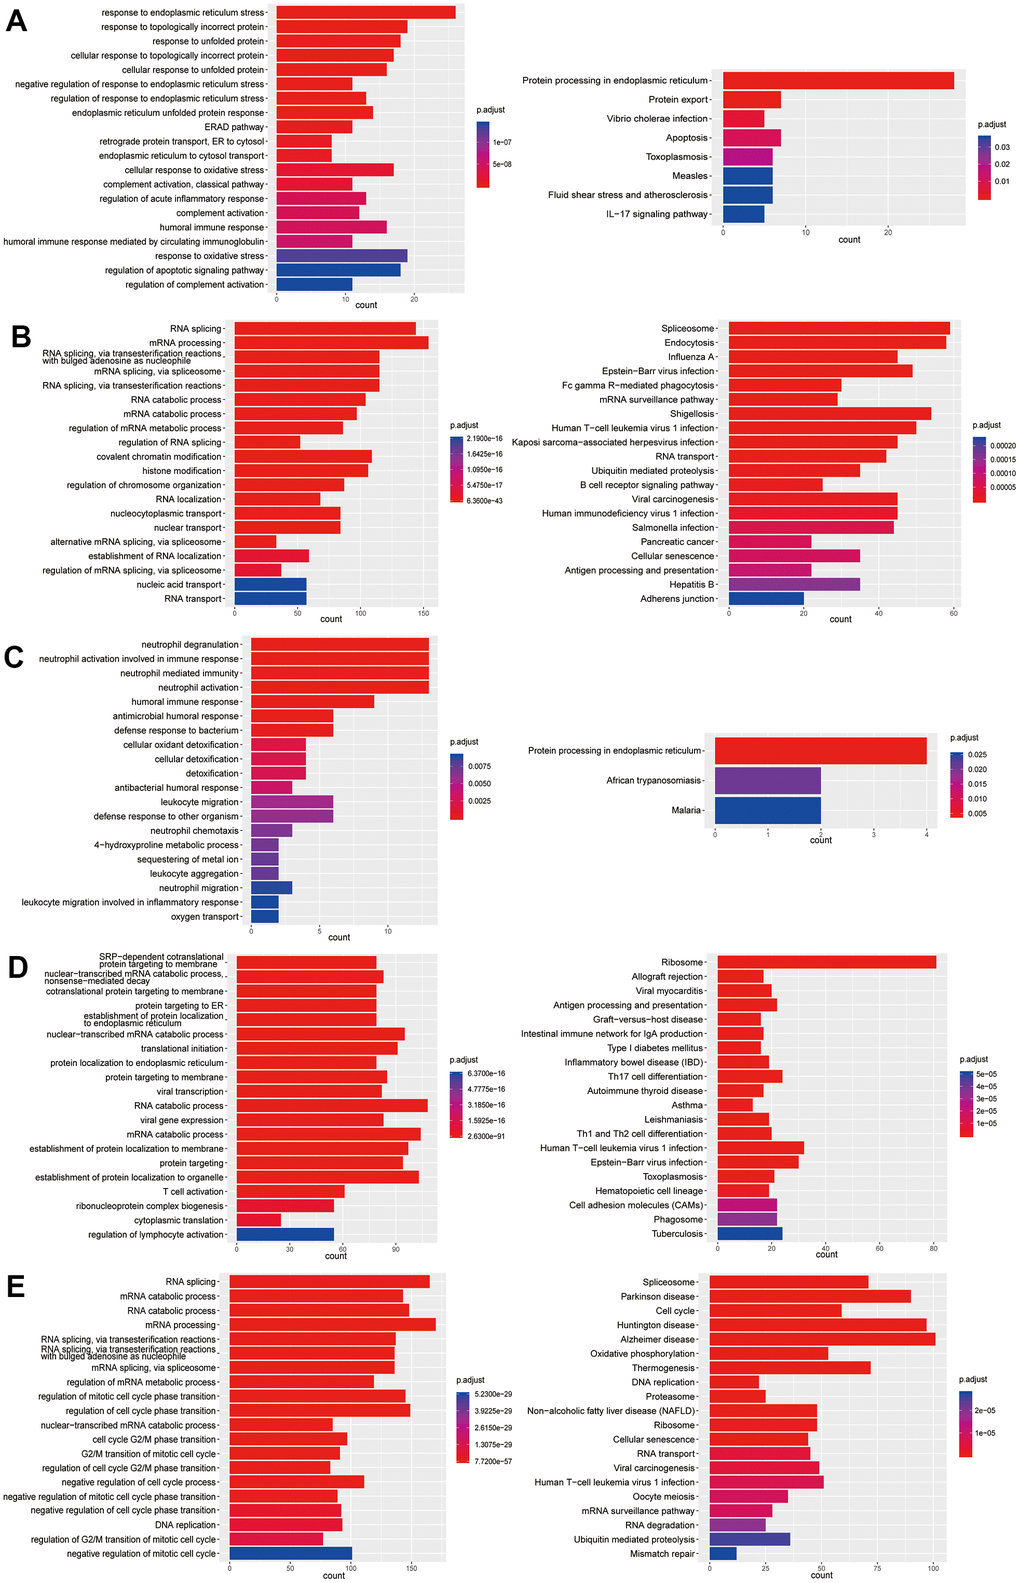
Figure 7. Enrichment analysis of subtypes in B cells (B1-B5). (A) GO (left) and KEGG (right) enrichment analysis of DEGs in B1. (B) GO (left) and KEGG (right) enrichment analysis of DEGs in B2. (C) GO (left) and KEGG (right) enrichment analysis of DEGs in B3. (D) GO (left) and KEGG (right) enrichment analysis of DEGs in B4. (E) GO (left) and KEGG (right) enrichment analysis of DEGs in B5.
Complex inter-cellular communication networks in human femoral head
We identified ligand-receptor pairs and molecular interactions among bone tissue cells (except granulocytes) (Figure 8A). Cognate receptors with broadcast ligands were detected, demonstrating extensive communication between osteoblastic lineage cells and other types of cells (Figure 8A, 8B). Our results suggested that chemokine, transforming growth factor and collagen had significant roles in inter-cellular communications (Figure 8C). The "CXCL12-CXCR4" interaction pair played important role in the crosstalks between bone tissue cells. Previous studies have reported that the CXCL12/CXCR4 signaling was involved in the regulation of bone homeostasis [19–21]. Notably, the "COL2A1-ITGB1" interaction pair was significant in the crosstalk between EPCs and osteoblastic lineage cells (Figure 8C). Additionally, compared with other cells, monocytes could act through COL1A1-/COL1A2-CD44 interaction pairs to perform closer cell communication (measured with interaction score) with osteoblastic lineage cells (Figure 8C).
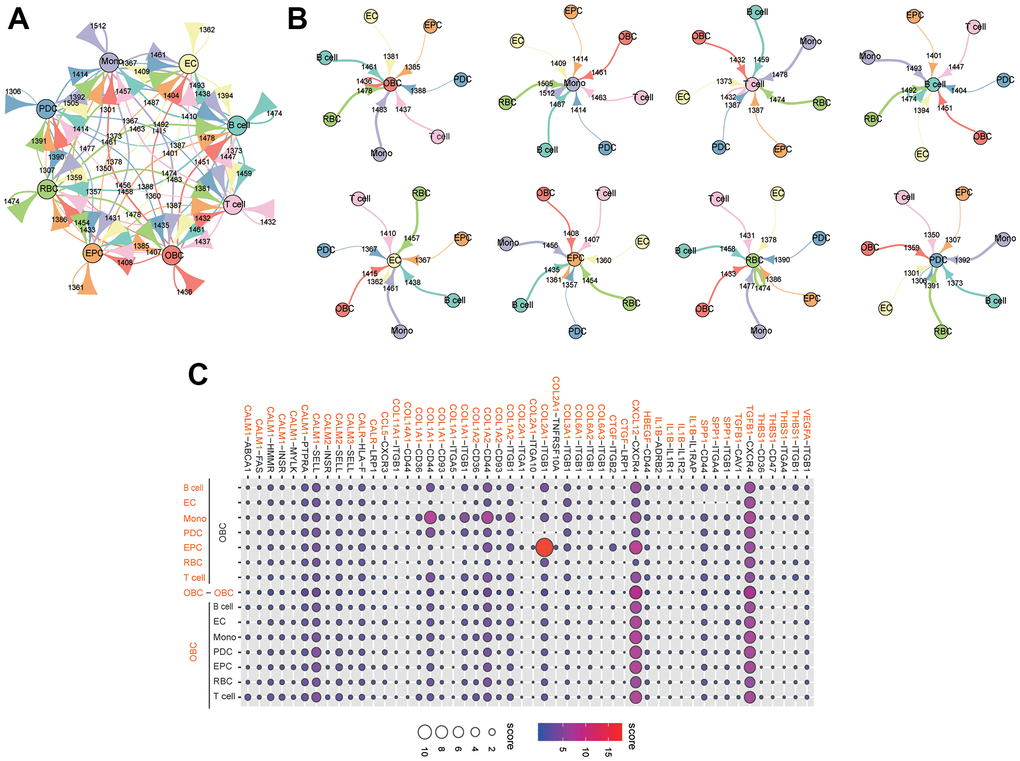
Figure 8. Extensive crosstalk networks in human femoral head tissue cells. (A) Capacity for inter-cellular communication between osteoblastic lineage cells and other cells in human femoral head. The map quantifies the potential communication, but does not consider the anatomical location or boundaries of the cell type. The color of each line indicates the ligands expressed by the same color cell type. The lines connect to the cell clusters types that express the cognate receptors. The thickness of line is proportional to the number of ligands. The loop indicates autocrine circuits. The number indicates the quantity of ligand-receptor pairs in each inter-cellular link. (B) Detailed view of the ligands and cognate receptors between each cell type. (C) Overview of selected ligand-receptor interactions of osteoblastic lineage cells. Interaction score is indicated by circle size and color. Mono: monocyte; EC: endothelial cell; OBC: osteoblastic lineage cell; EPC: endothelial progenitor cell; RBC: red blood cell; PDC: plasmacytoid dendritic cell.
Discussion
Bone is a complex tissue and undergoes modeling/remodeling constantly during life [22]. Various types of cells are involved in the regulation of bone homeostasis, such as bone cells, stromal cell, immune cells, endothelial cells, which also communicate with each other closely [4]. Therefore, it is fundamental to study the cellular composition of the bone tissue cells and the crosstalks between them. In this study, we applied scRNA-seq analyses on freshly isolated bone tissue cells from human femoral head. We identified two novel bone metabolism-related genes, PRSS23 and MXRA8. We discovered several subtypes of immune cells (monocytes, T cells and B cells) that may be involved in the regulation of bone metabolism. Finally, the cell-cell communication analysis suggested complex inter-cellular communication networks among human femoral head tissue cells, and the close crosstalk between EPCs and osteoblastic lineage cells via the "COL2A1-ITGB1" interaction pair. Our results provided an initial systematic dissection of human femoral head tissue at single-cell resolution and a global single-cell profile of how different cells work together in human femoral head.
To avoid potential alternation of transcriptome profiles caused by in vitro operations (e.g. culturing) [23], we performed scRNA-seq on the freshly isolated primary femoral head tissue cells. In addition, we identified two novel bone metabolism-related genes, PRSS23 and MXRA8, by analyzing the PPI network constructed from DEGs in osteoblastic lineage cells, and showed that the expression of these two genes were significantly increased during in vitro osteogenic differentiation. Based on our recent scRNA-seq data of BM-MSCs [24] and osteoblasts [25], PRSS23 was highly expressed in the osteoblast precursors and early osteoblasts (pre-osteoblast and undetermined osteoblast). This result suggested that PRSS23 may promote the differentiation of BM-MSCs into osteoblasts. Previous studies reported that, in breast cancer cells, PRSS23 was co-expressed with estrogen receptor α (ERα), and PRSS23 knockdown may suppress estrogen-driven cell proliferation of breast cancer cells [26]. Since estrogens were highly significant for bone metabolism and maintaining bone mineral density (BMD) [27], we speculated that PRSS23 may regulate bone metabolism through affecting ERα gene expression. Additionally, PRSS23 have been reported to interact with TGFB signaling pathways [28], and TGFB signaling pathway was significant for bone metabolism [29]. Therefore, we speculated that PRSS23 may also regulate bone metabolism through mediating the TGFB signaling pathway. MXRA8 was highly expressed in both BM-MSCs and osteoblasts (Figure 2D), suggesting that it may play a critical role in maintaining the activity and function of BM-MSCs and osteoblasts. Recent studies showed that MXRA8 was a lipid metabolism-related gene [30] and also related to the proliferation of growth plate chondrocytes [31]. Interestingly, MXRA8 is a cell adhesion molecule, as an entry mediator for arthritogenic alphaviruses [32], and arthritogenic alphaviruses would cause chronic musculoskeletal disease [33]. Taken together, PRSS23 and MXRA8 were likely related to bone metabolism in humans.
In the monocytes, we found the IL1B+ monocytes (M1) could regulate bone metabolism, and this subtype of monocytes have been reported as a key potential mediator of the pathogenesis of rheumatoid arthritis [34]. Besides, the IL1B+ monocytes (M1) contain the TRAP+CTSK+ osteoclasts precursor (Figure 3J). Among the T cells, we found the majority of CD8 T cells in bone tissue express GZMK, which is similar to the results in synovial tissue [34]. GO enrichment analysis suggested that GZMK+CCR6+CD8 T cells (T4) could promote osteoclastogenesis and enhance bone resorption. CCL20 was highly expressed in GZMK+CCR6+CD8 T cells (T4) (Figure 3K), and CCL20 can enhance osteoclastogenesis and induce osteoclast differentiation [35, 36]. In contrast, another subpopulation of CD8 T cells, GZMK+CXCL8+ T cells (T6), specifically express high levels of LTF (Figure 3K), which can inhibit the bone resorption mediated by osteoclasts [37]. Therefore, the previous notion that CD8 T cells are suppressive to bone resorption should be re-evaluated at single-cell level [38–40]. In addition, GO enrichment analysis suggested that the pre-B cells (only B5) may also regulate the differentiation of osteoblasts. Therefore, future studies are needed to further explore the functional roles of GZMK+CCR6+CD8 T cells (T4) and pre-B cells (only B5) on bone metabolism in the context of their in vivo functional importance in bone tissues.
To explore inter-cellular interaction in human femoral head tissue cells, we constructed the inter-cellular communication networks in femoral head based on known ligand-receptor interactions. In the network, EPCs closely communicated with osteoblastic lineage cells via "COL2A1-ITGB1" interaction. Since COL2A1 is a known chondrogenic marker [41], we suspected that EPCs may regulate chondrogenesis of osteoblastic lineage cells through "COL2A1-ITGB1" interaction. For novel bone metabolism-related genes, PRSS23 and MXRA8, we did not find any significant crosstalks in the cell-cell communication analysis, which is probably due to the very limited knowledge about the functions of these two genes.
Despite interesting and novel findings in this initial comprehensive characterization of cells and their interactions in vivo in human femoral head at single cell level, our study may have some limitations. First, due to limited amount of data (only 691 osteoblastic lineage cells detected in our dataset), we were unable to further dissect subpopulations of osteoblastic lineage cells. This is mainly because we performed scRNA-seq on the primary femoral head tissue cells without any purification/enrichment procedures specifically for osteoblastic lineage cells. Also, the samples of this study were from subjects with osteoporosis or osteopenia because appropriate bone samples can be obtained from these subjects during hip replacement therapy, and this might incur some bias in the cell subpopulation identification and proportion estimation compared with healthy individuals. Previous studies showed that the number and activity of osteoblastic lineage cells were significantly decreased in people with osteoporosis or osteopenia [42]. Therefore, we need to specifically isolate/enrich osteoblastic lineage cells from study subject with different health conditions in future studies. As the osteoblastic lineage cells are a heterogeneous cells population, a negative sorting approach can be adopted [43]. In addition, we were unable to detect osteoclasts in this study. This is as expected because the size of osteoclasts (150-200 μm in diameter) exceeds the upper limit of cell size (40 μm in diameter) compatible with the current 10x Genomics system, and thus osteoclasts were filtered out before the scRNA-seq library construction. In addition, osteoclasts are multinucleated cells with heterogeneous nuclei inside mature osteoclasts, and thus the current single-nucleus RNA-seq is not suitable for osteoclasts either [44]. In future studies, spatial transcriptomics may hopefully provide an opportunity to explore the cellular heterogeneity of osteoclasts and the relationship with bone metabolism [45].
In summary, our study characterized the cellular composition of the human femoral head tissue cells, and identified PRSS23 and MXRA8 as novel bone metabolism-related genes. The complex inter-cellular communication networks in human femoral head suggest that various types of cells are involved in the regulation of bone metabolism, and EPCs communicate with osteoblastic lineage cells closely via the "COL2A1-ITGB1" interaction pair. Our study provides a systematic dissection of human femoral head at the single-cell level, and shows the global single-cell profile of how different cells work together in human femoral head on the single-cell resolution, which is a unique resource for in-depth insights into bone metabolism.
In future studies, more subjects should be included to further dissect subpopulation of osteoblastic lineage cells, and to explore how different health states affect the bone metabolism and vice versa. Besides, by combining scRNA-seq with spatial transcriptomics [45] and scATAC-seq (a powerful tool to evaluate chromatin accessibility at the single-cell level) [46], we will aim to unveil the complicated crosstalk between bone tissue cells, and the gene regulatory network within/between them. In the meantime, deconvolution of the cellular heterogeneity of bone tissue cells in vivo in humans represents an important and necessary advancement step towards improving our understanding of bone physiological processes.
Materials and Methods
Study subjects
The study was approved by the Medical Ethics Committee of Xiangya Hospital of Central South University and written informed consent was obtained from all participants. The study subjects consisted of four Chinese subjects of Han ethnicity (detailed information of the study subjects provided in Supplementary Table 1), who underwent hip replacement surgery at Xiangya Hospital of Central South University. All the subjects were screened with a detailed questionnaire, medical history, physical examination, and measured for bone mineral density (BMD) before surgery. Subjects were excluded from the study if they had chronic diseases that may affect bone metabolism, including but not limited to renal failure, liver failure, diabetes mellitus, hematologic diseases, malabsorption syndrome, disorders of the thyroid/parathyroid, malignant tumors, ankylosing spondylitis, hyperprolactinemia, oophorectomy, or previous pathological fractures [47]. The femur head was collected from the patient during hip replacement surgery. The specimens were immediately stored at 4° C temporarily and transferred to the wet laboratory within 2 hours, where they were processed within 24 hours after delivery.
BMD measurement
BMD (g/cm2) was measured by the duel energy x-ray absorptiometry (DXA) fan-beam bone densitometer (Hologic QDR 4500A, Hologic, Inc., Bedford, MA, USA) at the right hip (femoral neck and trochanter) and the lumbar spine (L1-L4). According to the World Health Organization (WHO) definition [48] and the BMD reference established for Chinese [49], subject with T-score ≤ -2.5 is clinically diagnosed as osteoporosis, while T-score between -2.5 and -1 as osteopenia, and T-score > -1.0 are considered healthy.
Isolation of bone tissue cells
Bone tissue cells were extracted from the femoral head specimens based on widely used dissociation protocols with a few adjustments [50, 51]. First, femoral heads were washed three times with αMEM (Cat: SH30265.01, HyClone, USA) and dissected into small pieces of approximately 1-2 mm in diameter. Bone pieces (10 g wet weight) were placed into a 50 ml conical tube with 20 ml of 2 mg/ml collagenase type II (Cat: A004174-0001, Sangon Biotech, China) dissolved in αMEM with 100 U/ml Penicillin and 100μg/ml Streptomycin (Cat: 15140-122, Gibco, USA) and digested with gentle agitation for 25 minutes at 37° C. After that, the collagenase solution was aseptically removed and bone pieces were rinsed in 10 ml PBS for 3 times. Briefly, after five rounds of digestion, we combined the collagenase solutions from the last two rounds of digestion and filtered the solution through a 40 μm filter. Finally, we incubated the collected cells with red blood cell (RBC) lysis buffer (Cat: R1010, Solarbio, China) for 5 minutes and then washed it twice with PBS.
scRNA-seq library preparation and sequencing
scRNA-seq libraries were prepared using Single Cell 3’ Library Gel Bead Kit V3 following the manufacturer’s guidelines (https://support.10xgenomics.com/single-cell-gene-expression/library-prep/doc/user-guide-chromium-single-cell-3-reagent-kits-user-guide-v3-chemistry). Single cell 3’ Libraries contain the P5 and P7 primers used in Illumina bridge amplification PCR. The 10x Barcode and Read 1 (primer site for sequencing read 1) were added to the molecules during the GEM-RT incubation. The P5 primer, Read 2 (primer site for sequencing read 2), Sample Index and P7 primer were added during library construction. The protocol was designed to support library construction from a wide range of cDNA amplification yields spanning from 2 ng to > 2 μg without modification. Finally, scRNA-seq libraries were sequenced on the Illumina Novaseq6000 platform with a sequencing depth of at least 100,000 reads per cell for a 150bp paired end (PE150) run.
Pre-processing of scRNA-seq data
The FASTQ files were mapped to the human transcriptome (GRCh38/hg38) using Cell Ranger 3.0 (https://support.10xgenomics.com/single-cell-gene-expression/software/pipelines/latest/what-is-cell-ranger). To create Cell Ranger-compatible reference genomes, the references were rebuilt according to instructions from 10x Genomics (https://www.10xgenomics.com), which performs alignment, filtering, barcode counting and UMI counting. Finally, the digital gene expression matrix was generated. For quality control (QC), we used the R (version 3.6.1, https://www.r-project.org/) and Seurat R package (version 3.1, https://satijalab.org/seurat/) [52, 53] to calculate the distribution of genes detected per cell and remove the cells in the top or the bottom 2% quantile. We also excluded cells in which more than 10% of the transcripts were attributed to mitochondrial genes.
Dimension reduction and cluster identification
To visualize and cluster the data, we selected top 2,000 most variable genes for principal-component analysis (PCA), and then, we used the first 20 principal-components (PCs) for visualization by t-Distributed Stochastic Neighbor Embedding (t-SNE) [54]. Next, we performed an unbiased graph-based method for clustering analysis using the first 20 PCs [55]. To identify differentially expressed genes (DEGs) between clusters, Wilcoxon rank-sum test was used to identify genes showing significantly higher levels of expression (false discovery rate (FDR) < 0.05) in a specific cluster compared to the other clusters.
Pathway enrichment analysis
To investigate the biological processes and signal pathways associated with cell type, we performed gene ontology (GO) and Kyoto Encyclopedia of Genes and Genomes (KEGG) enrichment analyses for the genes that were identified as important DEGs for clusters (adjusted p value < 0.05), by using the clusterProfiler R package [56].
Protein-protein interaction (PPI) network, hub genes and module analysis
To identify the most significant gene among the DEGs in the context of functioning in gene networks, a PPI network of DEGs (selected with average log(Fold change) > 1.0, adjusted p value < 0.05) was constructed using the Search Tool for the Retrieval of Interacting Genes (STRING, http://string.embl.de/) [57]. The Cytoscape software (version 3.7.2) was applied to visualize and analyze the molecular interaction networks [58]. The hub genes of the PPI network were identified by cytoHubba (Cytoscape) [59]. The modules of the PPI network were selected by Molecular Complex Detection (MCODE) (Cytoscape) [60]. The biological analyses of hub genes were constructed using BiNGO (Cytoscape) [61].
Cell-cell communication analysis
To explore the potential interactions between cells in human femoral head, we used iTALK [62] to perform cell-cell communication analysis, which is an R toolkit for visualizing ligand-receptor-mediated inter-cellular interaction in scRNA-seq data. The product of average receptor expression and average ligand expression was calculated in each cell cluster to score the enriched receptor-ligand interactions.
Public datasets
We recently generated scRNA-seq datasets of human BM-MSCs and human osteoblasts [24, 25], which can be accessed from GEO database (https://www.ncbi.nlm.nih.gov/geo/) [63] under the accession numbers of GSE147287 and GSE147390, respectively. In this study, we processed these datasets using the same parameters as described in our previous studies [24, 25]. The gene expression profile of osteogenic differentiation by BM-MSCs in vitro was obtained from the GEO database with accession numbers GSE37558 [64]. And the data were log2 transformed and normalized using the quantile-normalization approach.
The data analyses of this study were divided into three parts, and illustrated in Figure 9.
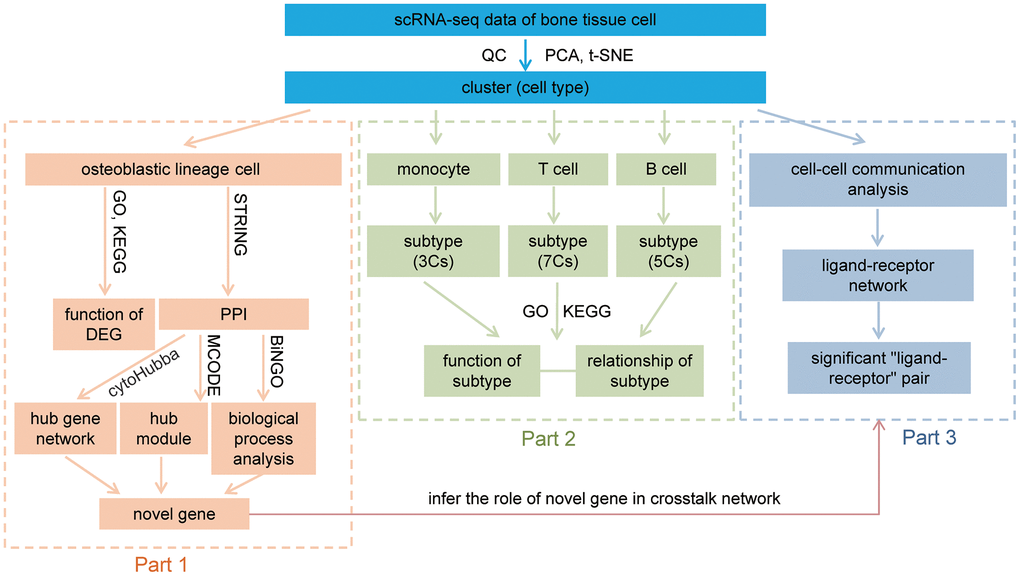
Figure 9. Workflow of this study. After QC, dimension reduction, and clustering of the data, we identify nine cell types in our data. The downstream analysis was divided into three parts. Part 1, analysis of osteoblastic lineage cells, functional analyses of osteoblastic lineage cells and identify novel bone metabolism-related gene. Part 2, revealing distinct subtypes in monocytes, T cells and B cells, and discussion their relationship with bone metabolism. Part 3, constructing the communication networks of human femoral head tissue cells, and inferring the role of novel metabolism-related gene in crosstalk network. QC: quality control; PCA: principal-component analysis; t-SNE: t-Distributed Stochastic Neighbor Embedding; GO: gene ontology enrichment analysis; KEGG: Kyoto Encyclopedia of Genes and Genomes enrichment analysis; DEG: differentially expressed gene; PPI: protein-protein interaction; MCODE: Molecular Complex Detection; Cs: clusters.
Ethics approval
The study was approved by the Medical Ethics Committee of Xiangya Hospital of Central South University, and the IRB approval number is No. 201912315.
Consent to participate
Written informed consent was obtained from all participants.
Consent for publication
All authors gave their consent for publication.
Availability of data and material
The scRNA-seq data of human femoral head tissue cells from four human samples is available in the GEO database with accession numbers GSE169396. The scRNA-seq data of human BM-MSCs and human osteoblasts are available in the GEO database with accession numbers GSE147287 and GSE108891. The data of osteogenic differentiation by BM-MSCs in vitro was obtained from the GEO database with accession numbers GSE37558.
Supplementary Materials
Author Contributions
Hong-Wen Deng, Hui Shen, Hong-Mei Xiao and Li-Jun Tan conceived, designed, initiated, directed and supervised the whole project. Xiang Qiu as the first author conducted data analysis and drafted the manuscript. Junxiao Yang, Liang Cheng, Xiaohua Li, and Huixi Zhang collected the human sample and corresponding clinical information. Xiang Qiu and Ying Liu performed the experiments. Hong-Wen Deng, Hui Shen, Zun Wang and Wanqiang Lv revised the manuscript. All authors participated in the discussions of the project and reviewed and/or revised the manuscript. All authors approved the final version of the manuscript.
Conflicts of Interest
The authors declare that they have no conflicts of interest.
Funding
This research was benefited by grants from the National Institutes of Health (R01AR069055, U19AG055373, P20GM109036, R01AG061917), National Natural Science Foundation of China (Grant No. 81902277), National Key R&D Program of China (Grant No. 2017YFC1001100), Natural Science Foundation of Hunan Province (S2019JJQNJJ2093), Changsha Science and Technology project (kq1907153), Central South University (Grant Nos. 164990007, 2018zzts886), and Xiangya Clinical Big Data Project (xyyydsj9).
References
- 1. Datta HK, Ng WF, Walker JA, Tuck SP, Varanasi SS. The cell biology of bone metabolism. J Clin Pathol. 2008; 61:577–87. https://doi.org/10.1136/jcp.2007.048868 [PubMed]
- 2. Karner CM, Long F. Wnt signaling and cellular metabolism in osteoblasts. Cell Mol Life Sci. 2017; 74:1649–57. https://doi.org/10.1007/s00018-016-2425-5 [PubMed]
- 3. Suda T, Takahashi N, Udagawa N, Jimi E, Gillespie MT, Martin TJ. Modulation of osteoclast differentiation and function by the new members of the tumor necrosis factor receptor and ligand families. Endocr Rev. 1999; 20:345–57. https://doi.org/10.1210/edrv.20.3.0367 [PubMed]
- 4. Sims NA, Walsh NC. Intercellular cross-talk among bone cells: new factors and pathways. Curr Osteoporos Rep. 2012; 10:109–17. https://doi.org/10.1007/s11914-012-0096-1 [PubMed]
- 5. Pirraco RP, Reis RL, Marques AP. Effect of monocytes/macrophages on the early osteogenic differentiation of hBMSCs. J Tissue Eng Regen Med. 2013; 7:392–400. https://doi.org/10.1002/term.535 [PubMed]
- 6. Li Y, Toraldo G, Li A, Yang X, Zhang H, Qian WP, Weitzmann MN. B cells and T cells are critical for the preservation of bone homeostasis and attainment of peak bone mass in vivo. Blood. 2007; 109:3839–48. https://doi.org/10.1182/blood-2006-07-037994 [PubMed]
- 7. Colucci S, Brunetti G, Rizzi R, Zonno A, Mori G, Colaianni G, Del Prete D, Faccio R, Liso A, Capalbo S, Liso V, Zallone A, Grano M. T cells support osteoclastogenesis in an in vitro model derived from human multiple myeloma bone disease: the role of the OPG/TRAIL interaction. Blood. 2004; 104:3722–30. https://doi.org/10.1182/blood-2004-02-0474 [PubMed]
- 8. Manabe N, Kawaguchi H, Chikuda H, Miyaura C, Inada M, Nagai R, Nabeshima Y, Nakamura K, Sinclair AM, Scheuermann RH, Kuro-o M. Connection between B lymphocyte and osteoclast differentiation pathways. J Immunol. 2001; 167:2625–31. https://doi.org/10.4049/jimmunol.167.5.2625 [PubMed]
- 9. Bai H, Chen T, Lu Q, Zhu W, Zhang J. Gene expression profiling of the bone trabecula in patients with osteonecrosis of the femoral head by RNA sequencing. J Biochem. 2019; 166:475–84. https://doi.org/10.1093/jb/mvz060 [PubMed]
- 10. Ho XD, Phung P, Le VQ, Nguyen VH, Reimann E, Prans E, Kõks G, Maasalu K, Le NT, Trinh LH, Nguyen HG, Märtson A, Kõks S. Whole transcriptome analysis identifies differentially regulated networks between osteosarcoma and normal bone samples. Exp Biol Med (Maywood). 2017; 242:1802–11. https://doi.org/10.1177/1535370217736512 [PubMed]
- 11. Papalexi E, Satija R. Single-cell RNA sequencing to explore immune cell heterogeneity. Nat Rev Immunol. 2018; 18:35–45. https://doi.org/10.1038/nri.2017.76 [PubMed]
- 12. Schelker M, Feau S, Du J, Ranu N, Klipp E, MacBeath G, Schoeberl B, Raue A. Estimation of immune cell content in tumour tissue using single-cell RNA-seq data. Nat Commun. 2017; 8:2032. https://doi.org/10.1038/s41467-017-02289-3 [PubMed]
- 13. Stubbington MJ, Rozenblatt-Rosen O, Regev A, Teichmann SA. Single-cell transcriptomics to explore the immune system in health and disease. Science. 2017; 358:58–63. https://doi.org/10.1126/science.aan6828 [PubMed]
- 14. Wei C, Jenks S, Sanz I. Polychromatic flow cytometry in evaluating rheumatic disease patients. Arthritis Res Ther. 2015; 17:46. https://doi.org/10.1186/s13075-015-0561-1 [PubMed]
- 15. Hwang B, Lee JH, Bang D. Single-cell RNA sequencing technologies and bioinformatics pipelines. Exp Mol Med. 2018; 50:1–14. https://doi.org/10.1038/s12276-018-0071-8 [PubMed]
- 16. Freeman BT, Jung JP, Ogle BM. Single-Cell RNA-Seq of Bone Marrow-Derived Mesenchymal Stem Cells Reveals Unique Profiles of Lineage Priming. PLoS One. 2015; 10:e0136199. https://doi.org/10.1371/journal.pone.0136199 [PubMed]
- 17. Barrett AN, Fong CY, Subramanian A, Liu W, Feng Y, Choolani M, Biswas A, Rajapakse JC, Bongso A. Human Wharton’s Jelly Mesenchymal Stem Cells Show Unique Gene Expression Compared with Bone Marrow Mesenchymal Stem Cells Using Single-Cell RNA-Sequencing. Stem Cells Dev. 2019; 28:196–211. https://doi.org/10.1089/scd.2018.0132 [PubMed]
- 18. Todd DJ, McHeyzer-Williams LJ, Kowal C, Lee AH, Volpe BT, Diamond B, McHeyzer-Williams MG, Glimcher LH. XBP1 governs late events in plasma cell differentiation and is not required for antigen-specific memory B cell development. J Exp Med. 2009; 206:2151–59. https://doi.org/10.1084/jem.20090738 [PubMed]
- 19. Fujio M, Yamamoto A, Ando Y, Shohara R, Kinoshita K, Kaneko T, Hibi H, Ueda M. Stromal cell-derived factor-1 enhances distraction osteogenesis-mediated skeletal tissue regeneration through the recruitment of endothelial precursors. Bone. 2011; 49:693–700. https://doi.org/10.1016/j.bone.2011.06.024 [PubMed]
- 20. Hosogane N, Huang Z, Rawlins BA, Liu X, Boachie-Adjei O, Boskey AL, Zhu W. Stromal derived factor-1 regulates bone morphogenetic protein 2-induced osteogenic differentiation of primary mesenchymal stem cells. Int J Biochem Cell Biol. 2010; 42:1132–41. https://doi.org/10.1016/j.biocel.2010.03.020 [PubMed]
- 21. Qin HJ, Xu T, Wu HT, Yao ZL, Hou YL, Xie YH, Su JW, Cheng CY, Yang KF, Zhang XR, Chai Y, Yu B, Cui Z. SDF-1/CXCR4 axis coordinates crosstalk between subchondral bone and articular cartilage in osteoarthritis pathogenesis. Bone. 2019; 125:140–50. https://doi.org/10.1016/j.bone.2019.05.010 [PubMed]
- 22. Raut N, Wicks SM, Lawal TO, Mahady GB. Epigenetic regulation of bone remodeling by natural compounds. Pharmacol Res. 2019; 147:104350. https://doi.org/10.1016/j.phrs.2019.104350 [PubMed]
- 23. Neumann E, Riepl B, Knedla A, Lefèvre S, Tarner IH, Grifka J, Steinmeyer J, Schölmerich J, Gay S, Müller-Ladner U. Cell culture and passaging alters gene expression pattern and proliferation rate in rheumatoid arthritis synovial fibroblasts. Arthritis Res Ther. 2010; 12:R83. https://doi.org/10.1186/ar3010 [PubMed]
- 24. Wang Z, Li X, Yang J, Gong Y, Zhang H, Qiu X, Liu Y, Zhou C, Chen Y, Greenbaum J, Cheng L, Hu Y, Xie J, et al. Single-cell RNA sequencing deconvolutes the in vivo heterogeneity of human bone marrow-derived mesenchymal stem cells. bioRxiv. 2020. [Epub ahead of print]. https://doi.org/10.1101/2020.04.06.027904
- 25. Gong Y, Yang J, Li X, Zhou C, Chen Y, Wang Z, Qiu X, Liu Y, Zhang H, Greenbaum J, Cheng L, Hu Y, Xie J, et al. A systematic dissection of human primary osteoblasts in vivo at single-cell resolution. bioRxiv. 2020. [Epub ahead of print]. https://doi.org/10.1101/2020.05.12.091975
- 26. Chan HS, Chang SJ, Wang TY, Ko HJ, Lin YC, Lin KT, Chang KM, Chuang YJ. Serine protease PRSS23 is upregulated by estrogen receptor α and associated with proliferation of breast cancer cells. PLoS One. 2012; 7:e30397. https://doi.org/10.1371/journal.pone.0030397 [PubMed]
- 27. Khalid AB, Krum SA. Estrogen receptors alpha and beta in bone. Bone. 2016; 87:130–35. https://doi.org/10.1016/j.bone.2016.03.016 [PubMed]
- 28. Chen IH, Wang HH, Hsieh YS, Huang WC, Yeh HI, Chuang YJ. PRSS23 is essential for the Snail-dependent endothelial-to-mesenchymal transition during valvulogenesis in zebrafish. Cardiovasc Res. 2013; 97:443–53. https://doi.org/10.1093/cvr/cvs355 [PubMed]
- 29. Crane JL, Cao X. Bone marrow mesenchymal stem cells and TGF-β signaling in bone remodeling. J Clin Invest. 2014; 124:466–72. https://doi.org/10.1172/JCI70050 [PubMed]
- 30. Bazile J, Jaffrezic F, Dehais P, Reichstadt M, Klopp C, Laloe D, Bonnet M. Molecular signatures of muscle growth and composition deciphered by the meta-analysis of age-related public transcriptomics data. Physiol Genomics. 2020; 52:322–32. https://doi.org/10.1152/physiolgenomics.00020.2020 [PubMed]
- 31. Emrani H, Masoudi AA, Vaez Torshizi R, Ehsani A. Genome-wide association study of shank length and diameter at different developmental stages in chicken F2 resource population. Anim Genet. 2020; 51:722–30. https://doi.org/10.1111/age.12981 [PubMed]
- 32. Zhang R, Kim AS, Fox JM, Nair S, Basore K, Klimstra WB, Rimkunas R, Fong RH, Lin H, Poddar S, Crowe JE
Jr , Doranz BJ, Fremont DH, Diamond MS. Mxra8 is a receptor for multiple arthritogenic alphaviruses. Nature. 2018; 557:570–74. https://doi.org/10.1038/s41586-018-0121-3 [PubMed] - 33. Weaver SC, Charlier C, Vasilakis N, Lecuit M. Zika, Chikungunya, and Other Emerging Vector-Borne Viral Diseases. Annu Rev Med. 2018; 69:395–408. https://doi.org/10.1146/annurev-med-050715-105122 [PubMed]
- 34. Zhang F, Wei K, Slowikowski K, Fonseka CY, Rao DA, Kelly S, Goodman SM, Tabechian D, Hughes LB, Salomon-Escoto K, Watts GF, Jonsson AH, Rangel-Moreno J, et al, and Accelerating Medicines Partnership Rheumatoid Arthritis and Systemic Lupus Erythematosus (AMP RA/SLE) Consortium. Defining inflammatory cell states in rheumatoid arthritis joint synovial tissues by integrating single-cell transcriptomics and mass cytometry. Nat Immunol. 2019; 20:928–42. https://doi.org/10.1038/s41590-019-0378-1 [PubMed]
- 35. Lisignoli G, Piacentini A, Cristino S, Grassi F, Cavallo C, Cattini L, Tonnarelli B, Manferdini C, Facchini A. CCL20 chemokine induces both osteoblast proliferation and osteoclast differentiation: Increased levels of CCL20 are expressed in subchondral bone tissue of rheumatoid arthritis patients. J Cell Physiol. 2007; 210:798–806. https://doi.org/10.1002/jcp.20905 [PubMed]
- 36. Pathak JL, Bakker AD, Verschueren P, Lems WF, Luyten FP, Klein-Nulend J, Bravenboer N. CXCL8 and CCL20 Enhance Osteoclastogenesis via Modulation of Cytokine Production by Human Primary Osteoblasts. PLoS One. 2015; 10:e0131041. https://doi.org/10.1371/journal.pone.0131041 [PubMed]
- 37. Icriverzi M, Dinca V, Moisei M, Evans RW, Trif M, Roseanu A. Lactoferrin in Bone Tissue Regeneration. Curr Med Chem. 2020; 27:838–53. https://doi.org/10.2174/0929867326666190503121546 [PubMed]
- 38. Choi Y, Woo KM, Ko SH, Lee YJ, Park SJ, Kim HM, Kwon BS. Osteoclastogenesis is enhanced by activated B cells but suppressed by activated CD8(+) T cells. Eur J Immunol. 2001; 31:2179–88. https://doi.org/10.1002/1521-4141(200107)31:7<2179::aid-immu2179>3.0.co;2-x [PubMed]
- 39. Dar HY, Singh A, Shukla P, Anupam R, Mondal RK, Mishra PK, Srivastava RK. High dietary salt intake correlates with modulated Th17-Treg cell balance resulting in enhanced bone loss and impaired bone-microarchitecture in male mice. Sci Rep. 2018; 8:2503. https://doi.org/10.1038/s41598-018-20896-y [PubMed]
- 40. Shashkova EV, Trivedi J, Cline-Smith AB, Ferris C, Buchwald ZS, Gibbs J, Novack D, Aurora R. Osteoclast-Primed Foxp3+ CD8 T Cells Induce T-bet, Eomesodermin, and IFN-γ To Regulate Bone Resorption. J Immunol. 2016; 197:726–35. https://doi.org/10.4049/jimmunol.1600253 [PubMed]
- 41. Kavand H, van Lintel H, Renaud P. Efficacy of pulsed electromagnetic fields and electromagnetic fields tuned to the ion cyclotron resonance frequency of Ca2+ on chondrogenic differentiation. J Tissue Eng Regen Med. 2019; 13:799–811. https://doi.org/10.1002/term.2829 [PubMed]
- 42. Manolagas SC. Birth and death of bone cells: basic regulatory mechanisms and implications for the pathogenesis and treatment of osteoporosis. Endocr Rev. 2000; 21:115–37. https://doi.org/10.1210/edrv.21.2.0395 [PubMed]
- 43. Chia LY, Walsh NC, Martin TJ, Sims NA. Isolation and gene expression of haematopoietic-cell-free preparations of highly purified murine osteocytes. Bone. 2015; 72:34–42. https://doi.org/10.1016/j.bone.2014.11.005 [PubMed]
- 44. Sun W, Dong H, Balaz M, Slyper M, Drokhlyansky E, Colleluori G, Giordano A, Kovanicova Z, Stefanicka P, Balazova L, Ding L, Husted AS, Rudofsky G, et al. snRNA-seq reveals a subpopulation of adipocytes that regulates thermogenesis. Nature. 2020; 587:98–102. https://doi.org/10.1038/s41586-020-2856-x [PubMed]
- 45. Chen WT, Lu A, Craessaerts K, Pavie B, Sala Frigerio C, Corthout N, Qian X, Laláková J, Kühnemund M, Voytyuk I, Wolfs L, Mancuso R, Salta E, et al. Spatial Transcriptomics and In Situ Sequencing to Study Alzheimer’s Disease. Cell. 2020; 182:976–91.e19. https://doi.org/10.1016/j.cell.2020.06.038 [PubMed]
- 46. Satpathy AT, Granja JM, Yost KE, Qi Y, Meschi F, McDermott GP, Olsen BN, Mumbach MR, Pierce SE, Corces MR, Shah P, Bell JC, Jhutty D, et al. Massively parallel single-cell chromatin landscapes of human immune cell development and intratumoral T cell exhaustion. Nat Biotechnol. 2019; 37:925–36. https://doi.org/10.1038/s41587-019-0206-z [PubMed]
- 47. Xie H, Sun M, Liao XB, Yuan LQ, Sheng ZF, Meng JC, Wang D, Yu ZY, Zhang LY, Zhou HD, Luo XH, Li H, Wu XP, et al. Estrogen receptor α36 mediates a bone-sparing effect of 17β-estrodiol in postmenopausal women. J Bone Miner Res. 2011; 26:156–68. https://doi.org/10.1002/jbmr.169 [PubMed]
- 48. Kanis JA, Melton LJ 3rd, Christiansen C, Johnston CC, Khaltaev N. The diagnosis of osteoporosis. J Bone Miner Res. 1994; 9:1137–41. https://doi.org/10.1002/jbmr.5650090802 [PubMed]
- 49. Wu XP, Liao EY, Zhang H, Shan PF, Cao XZ, Liu SP. Establishment of BMD reference plots and determination of peak BMD at multiple skeletal regions in mainland Chinese women and the diagnosis of osteoporosis. Osteoporos Int. 2004; 15:71–79. https://doi.org/10.1007/s00198-003-1517-x [PubMed]
- 50. Nijweide PJ, van der Plas A, Alblas MJ, Klein-Nulend J. Osteocyte isolation and culture. Methods Mol Med. 2003; 80:41–50. https://doi.org/10.1385/1-59259-366-6:41 [PubMed]
- 51. Prideaux M, Schutz C, Wijenayaka AR, Findlay DM, Campbell DG, Solomon LB, Atkins GJ. Isolation of osteocytes from human trabecular bone. Bone. 2016; 88:64–72. https://doi.org/10.1016/j.bone.2016.04.017 [PubMed]
- 52. Satija R, Farrell JA, Gennert D, Schier AF, Regev A. Spatial reconstruction of single-cell gene expression data. Nat Biotechnol. 2015; 33:495–502. https://doi.org/10.1038/nbt.3192 [PubMed]
- 53. Stuart T, Butler A, Hoffman P, Hafemeister C, Papalexi E, Mauck WM 3rd, Hao Y, Stoeckius M, Smibert P, Satija R. Comprehensive Integration of Single-Cell Data. Cell. 2019; 177:1888–902.e21. https://doi.org/10.1016/j.cell.2019.05.031 [PubMed]
- 54. Lvd M, Hinton G. Visualizing Data using t-SNE. J Mach Learn Res. 2008; 9: 2579–605.
- 55. Blondel VD, Guillaume JL, Lambiotte R, Lefebvre E. Fast unfolding of communities in large networks. J Stat Mech. 2008: P10008. https://doi.org/10.1088/1742-5468/2008/10/P10008
- 56. Yu G, Wang LG, Han Y, He QY. clusterProfiler: an R package for comparing biological themes among gene clusters. OMICS. 2012; 16:284–87. https://doi.org/10.1089/omi.2011.0118 [PubMed]
- 57. Szklarczyk D, Franceschini A, Wyder S, Forslund K, Heller D, Huerta-Cepas J, Simonovic M, Roth A, Santos A, Tsafou KP, Kuhn M, Bork P, Jensen LJ, von Mering C. STRING v10: protein-protein interaction networks, integrated over the tree of life. Nucleic Acids Res. 2015; 43:D447–52. https://doi.org/10.1093/nar/gku1003 [PubMed]
- 58. Shannon P, Markiel A, Ozier O, Baliga NS, Wang JT, Ramage D, Amin N, Schwikowski B, Ideker T. Cytoscape: a software environment for integrated models of biomolecular interaction networks. Genome Res. 2003; 13:2498–504. https://doi.org/10.1101/gr.1239303 [PubMed]
- 59. Chin CH, Chen SH, Wu HH, Ho CW, Ko MT, Lin CY. cytoHubba: identifying hub objects and sub-networks from complex interactome. BMC Syst Biol. 2014 (Suppl 4); 8:S11. https://doi.org/10.1186/1752-0509-8-S4-S11 [PubMed]
- 60. Bader GD, Hogue CW. An automated method for finding molecular complexes in large protein interaction networks. BMC Bioinformatics. 2003; 4:2. https://doi.org/10.1186/1471-2105-4-2 [PubMed]
- 61. Maere S, Heymans K, Kuiper M. BiNGO: a Cytoscape plugin to assess overrepresentation of gene ontology categories in biological networks. Bioinformatics. 2005; 21:3448–49. https://doi.org/10.1093/bioinformatics/bti551 [PubMed]
- 62. Wang Y, Wang R, Zhang S, Song S, Jiang C, Han G, Wang M, Ajani J, Futreal A, Wang L. iTALK: an R Package to Characterize and Illustrate Intercellular Communication. bioRxiv. 2019. [Epub ahead of print]. https://doi.org/10.1101/507871
- 63. Barrett T, Wilhite SE, Ledoux P, Evangelista C, Kim IF, Tomashevsky M, Marshall KA, Phillippy KH, Sherman PM, Holko M, Yefanov A, Lee H, Zhang N, et al. NCBI GEO: archive for functional genomics data sets--update. Nucleic Acids Res. 2013; 41:D991–95. https://doi.org/10.1093/nar/gks1193 [PubMed]
- 64. Alves RD, Eijken M, van de Peppel J, van Leeuwen JP. Calcifying vascular smooth muscle cells and osteoblasts: independent cell types exhibiting extracellular matrix and biomineralization-related mimicries. BMC Genomics. 2014; 15:965. https://doi.org/10.1186/1471-2164-15-965 [PubMed]