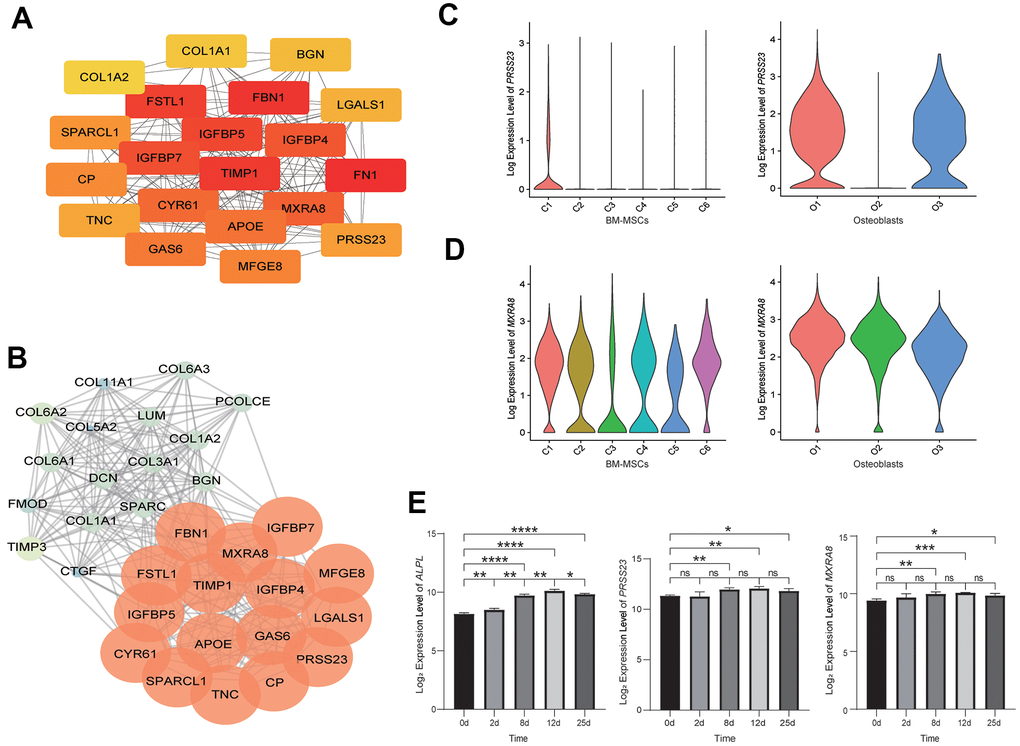
Figure 2.Analysis of osteoblastic lineage cells. (A) Gene network analysis of DEGs. The top 20 hub genes in the network. The color changes from yellow to red, indicating low to high connectivity. (B) The top MCODE-score module (module 1) screened from the PPI network. The color changes from blue to red, indicating low to high MCODE-score. (C) The expression level of PRSS23 in BM-MSCs (left) and osteoblasts (right). C1: osteoblast precursor; C2: adipocyte precursor; C3: terminal 1; C4: terminal 2; C5: contaminated; C6: chondrocyte precursor; O1: pre-osteoblast (early osteoblast); O2: mature osteoblast; O3: undetermined osteoblast (early osteoblast). (D) The expression level of MXRA8 in BM-MSCs (left) and osteoblasts (right). (E) The expression levels of alkaline phosphatase (ALPL), PRSS23 and MXRA8 during in vitro osteogenic differentiation from BM-MSCs (left to right). X-axis represents time (days) of induce differentiation and y-axis reflects log2-normalized gene expression levels. Stars indicate significance level of gene expression difference between two samples by t-test. ns, not significant; *, p value < 0.05; **, p value < 0.01; ***, p value < 0.001; ****, p value < 0.0001.