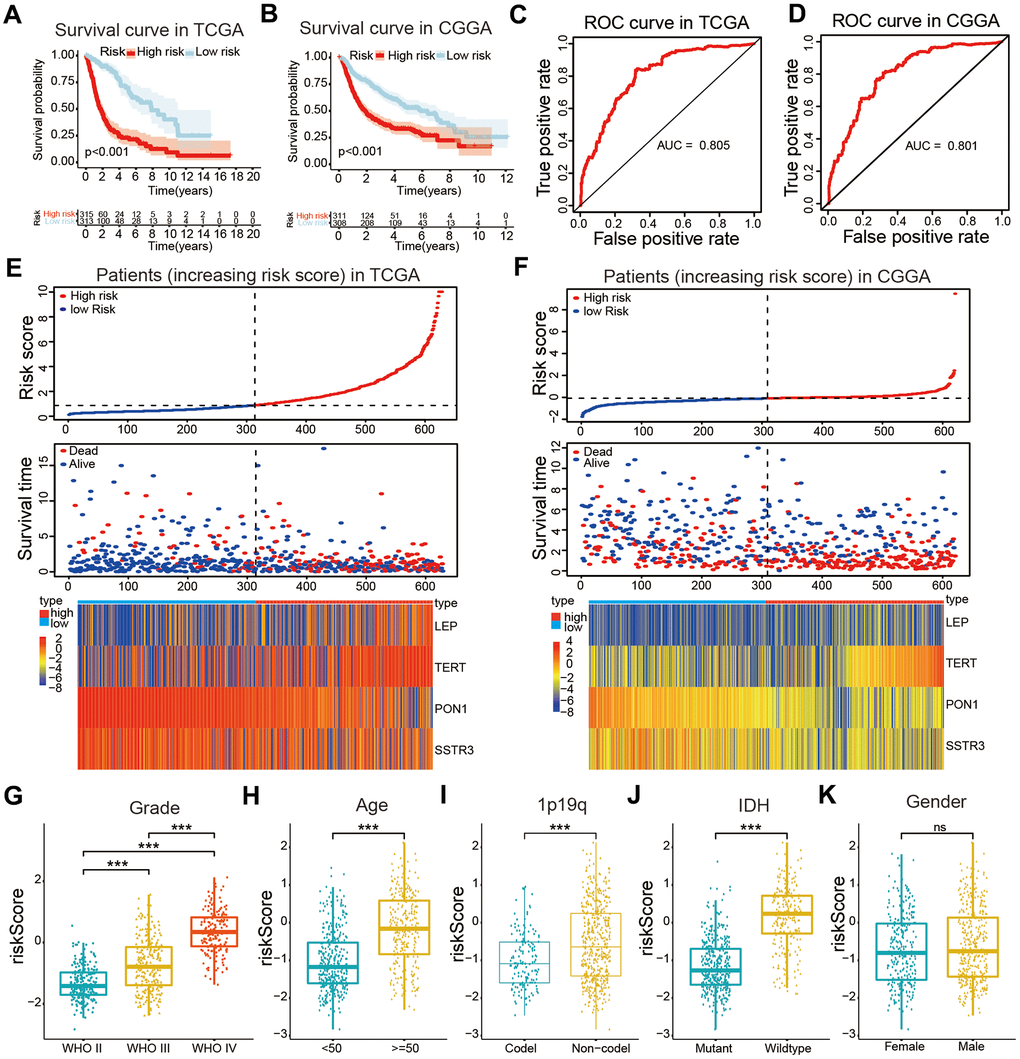
Figure 4.Construction of a risk model and the association of the risk model with clinical characteristics of patients with glioma. (A, B) Kaplan-Meier (KM) curves for overall survival (OS) prediction based on the training (TCGA) and validation (CGGA) datasets. (C, D) Receiver operating characteristic (ROC) curves for the risk model both in the training and validation datasets. (E, F) Risk plot distribution, survival status of patients, and heatmap of expression of included genes in the training and validation datasets. (G–K) Relationships between the risk score and clinical characteristics (grade, age, 1p19q status, IDH status, and gender) of patients with glioma. Non-significant (ns) P > 0.05, * P < 0.05, ** P < 0.01, and *** P < 0.001.