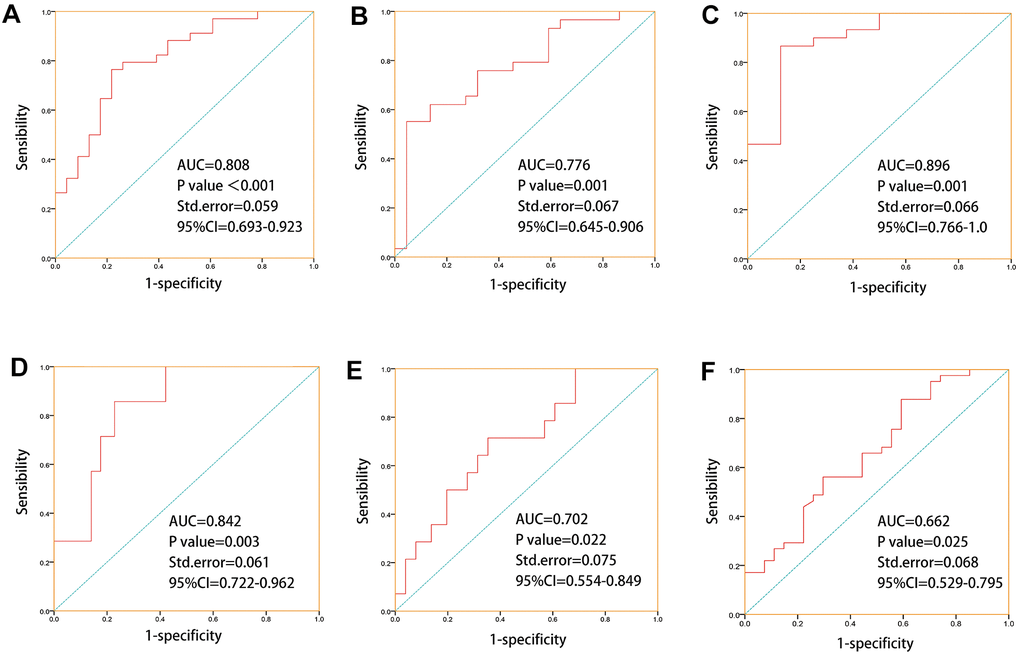
Figure 5.ROC prediction models were established for “primary therapy outcome success, treatment success, drug response, stage event. PSA value, biochemical recurrence, new tumor event after initial treatment” based on drug metabolism-related core genes which with good correlations to chemotherapy or endocrine therapy drugs sensitivities. (A) ROC prediction model for primary treatment outcome success (AUC=0.808, P=0, SD=0.059). (B) ROC prediction model for treatment success (AUC =0.776, P=0.001, SD=0.067). (C) ROC prediction model for drug response (AUC =0.896, P=0.001, SD=0.066). (D) ROC prediction model for stage event. PSA value (AUC =0.842, P=0.003, SD=0.061). (E) ROC prediction model for biochemical recurrence (AUC =0.702, P=0.022, SD=0.075). (F) ROC prediction model for new tumor event after initial treatment(AUC =0.662, P=0.025, SD=0.068).