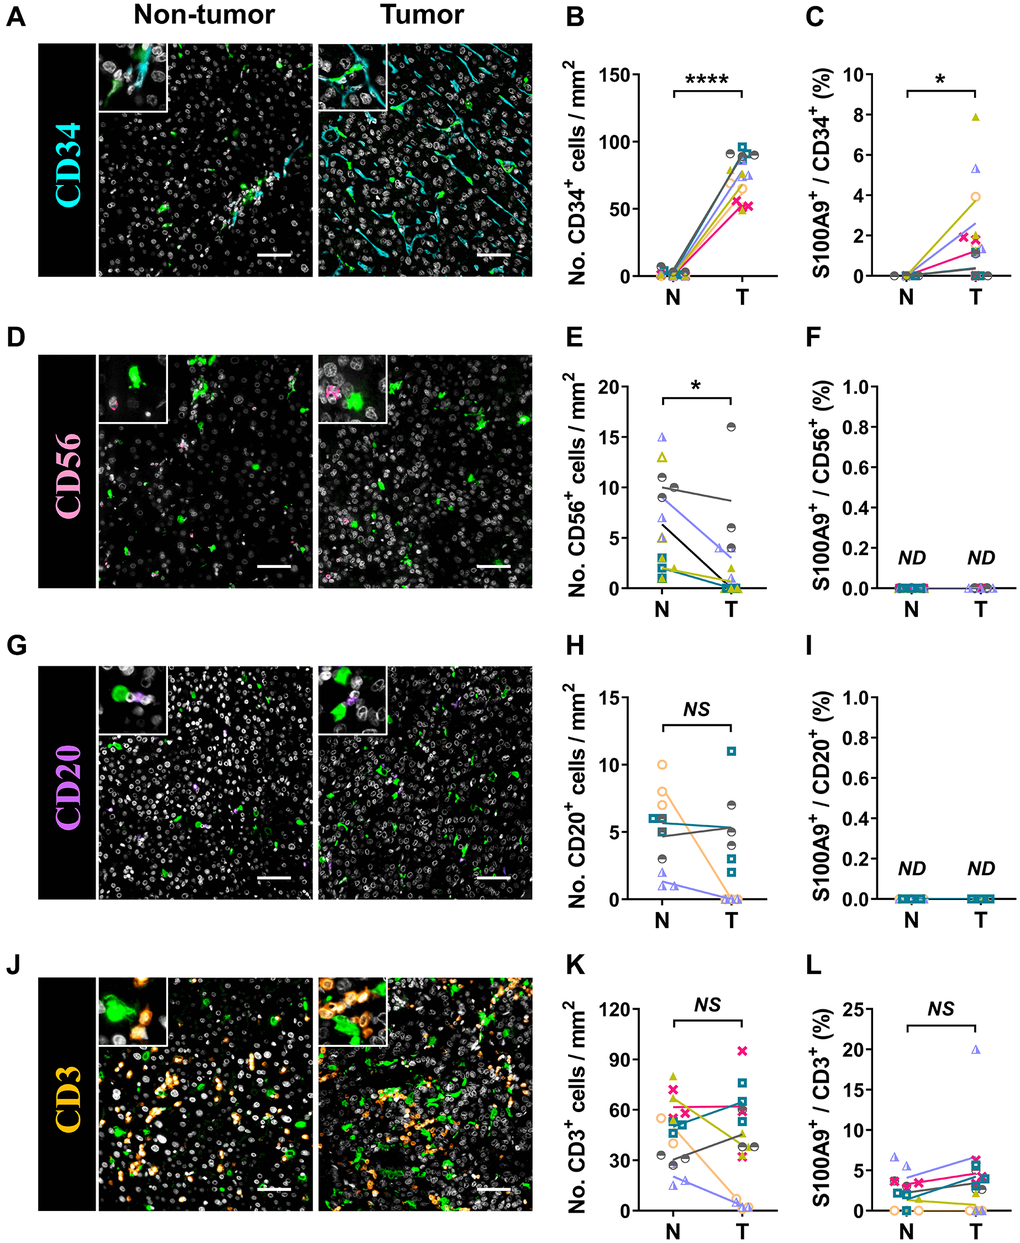
Figure 5.Characterization of patient-derived S100A9+ cells. Multiple immunofluorescence staining shows DAPI (gray), S100A9 (green), CD34 (blue, A), CD56 (pink, D), CD20 (purple, G), and CD3 (orange, J) expression and coexpression (double-positive cells) in HCC tissue. Quantification of CD34 (B), CD56 (E), CD20 (H), and CD3 (K) cell densities in the T and N regions. (C) The percentages of S100A9+CD34+ cells among the total CD34+ cells in the N and T regions. (F) The percentages of S100A9+CD56+ cells among the total CD56+ cells in the N and T regions. (I) The percentages of S100A9+CD20+ cells among the total CD20+ cells in the N and T regions. (L) The percentages of S100A9+CD3+ cells among total CD3+ cells in the N and T regions (n = 4 - 7). Scale bar = 50 μm. The results are the means ± SEM (bars); NS, no significance; ND, not detected.