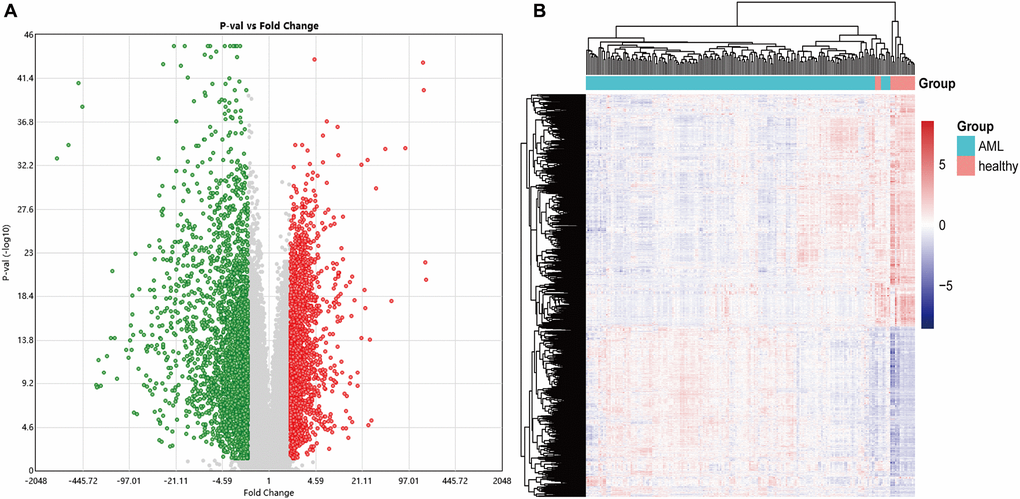
Figure 2.The volcano and heatmap of the differentially expressed genes. (A) In the DEGs' volcano plot, red dots are up-regulated genes, blue is down-regulated, and grey is no different; (B) DEGs clustering heatmap, pink indicates healthy, and blue indicates AML. DEGs: differentially expressed genes.