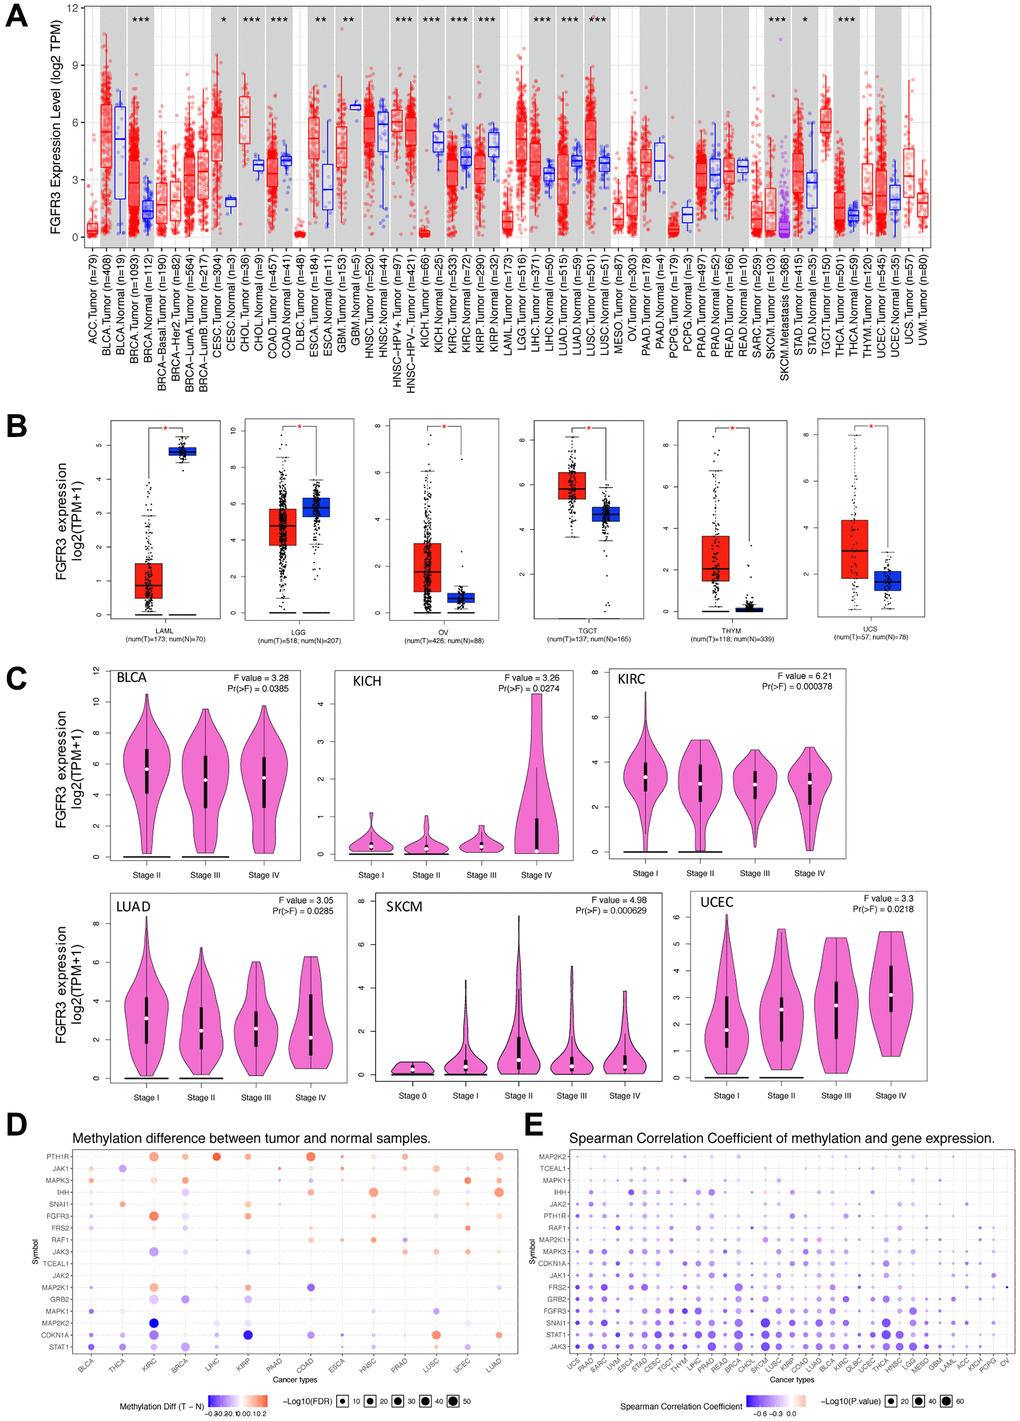
Figure 1.Fibroblast growth factor receptor 3 (FGFR3) mRNA expression and DNA methylation in The Cancer Genome Atlas (TCGA) tumor tissues. (A) The mRNA expression of FGFR3 in different cancers or specific cancer subtypes from TIMER2. The log2 [TPM (Transcripts per million)] was applied for log-scale. (B) For LAML, LGG, OV, TGCT, THYM, and UCS from the TCGA project, their corresponding normal tissues of the GTEx database were included as controls based on the GEPIA2 portal. The log2 (TPM +1) was applied for log-scale. (C) FGFR3 mRNA expression levels were analyzed by the main pathological stages of BLCA, KICH, KIRC, LUAD, SKCM, and UCEC. The log2 (TPM +1) was applied for log-scale. (D) Bubble map showing the differential methylation of FGFR3 and its downstream genes between tumors and matched normal samples. Blue dots, downregulated methylation in tumors. Red dots, upregulated methylation in tumors. (E) Bubble map depicting the relative methylation and expression differences of FGFR3 and its downstream genes between tumors and matched normal samples by size and color, respectively. Blue dots, upregulation in methylation level but downregulation in expression level. Red dots, upregulation in both methylation and expression levels of indicated genes. *P < 0.05; **P < 0.01; ***P < 0.001.