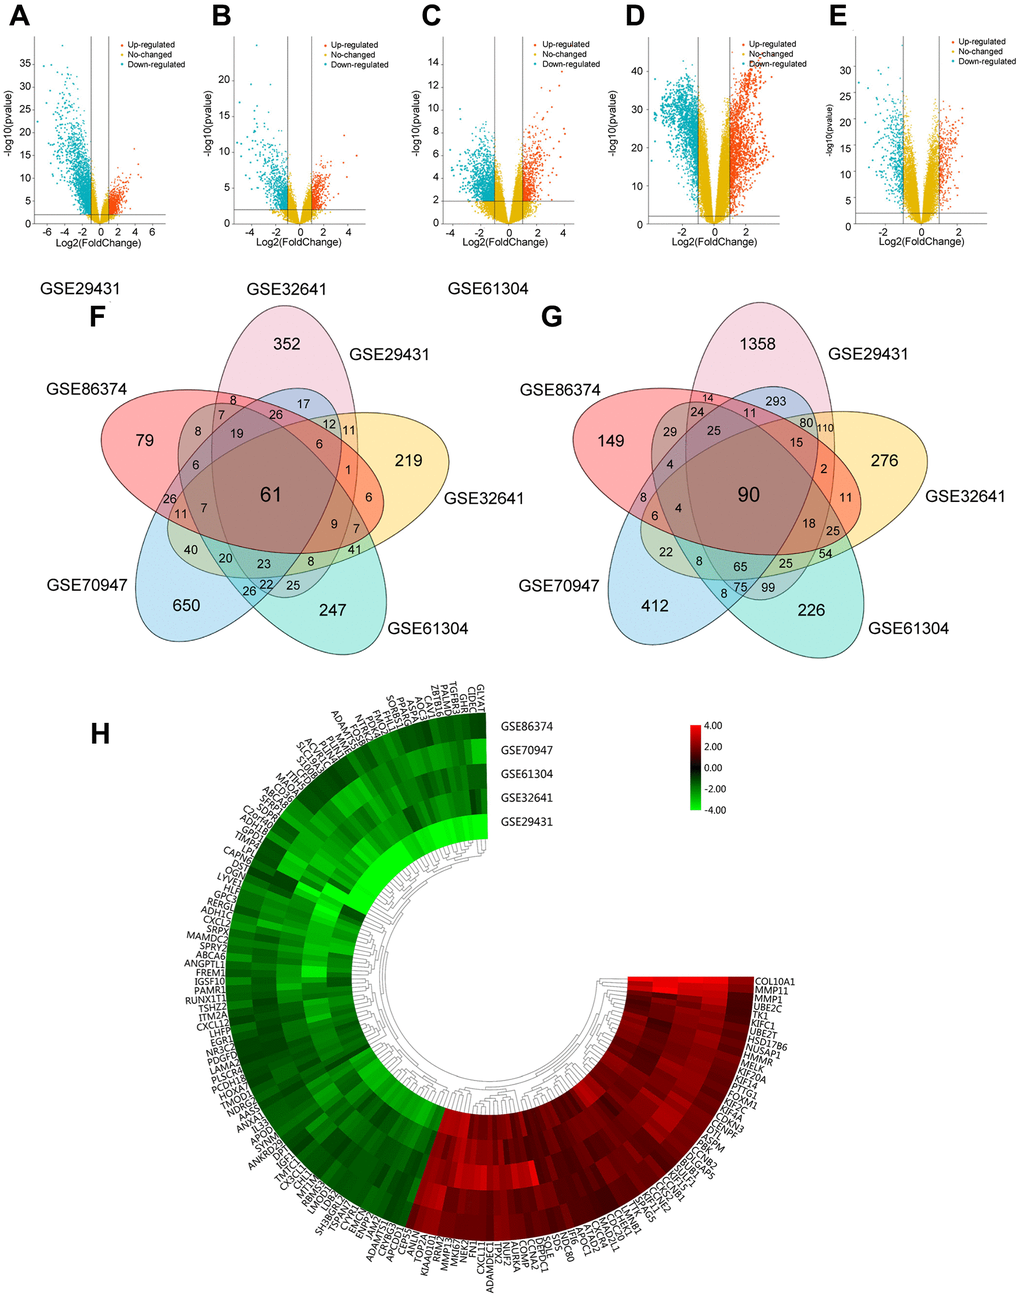
Figure 1.Foundation of DEGs in five GEO databases. (A–E) The display of DEGs in each database by volcano plots. Datasets from GSE29431 (A), GSE32641 (B), GSE61304 (C), GSE70947 (D) and GSE86374 (E). Orange: Up-regulated genes (logFC ≥ 1.0, adj. P < 0.05); Blue: Down-regulated genes (logFC ≤ -1.0, adj. P < 0.05); Yellow: Genes with no significance. (F–G) A Total of 61 significantly upregulated genes (F) and 90 significantly downregulated genes (G) were screened from the five GEO databases. (H) Hierarchical clustering heatmap showed expression of 151 DEGs in five GEO databases. Red: higher expression genes, green: lower expression genes.