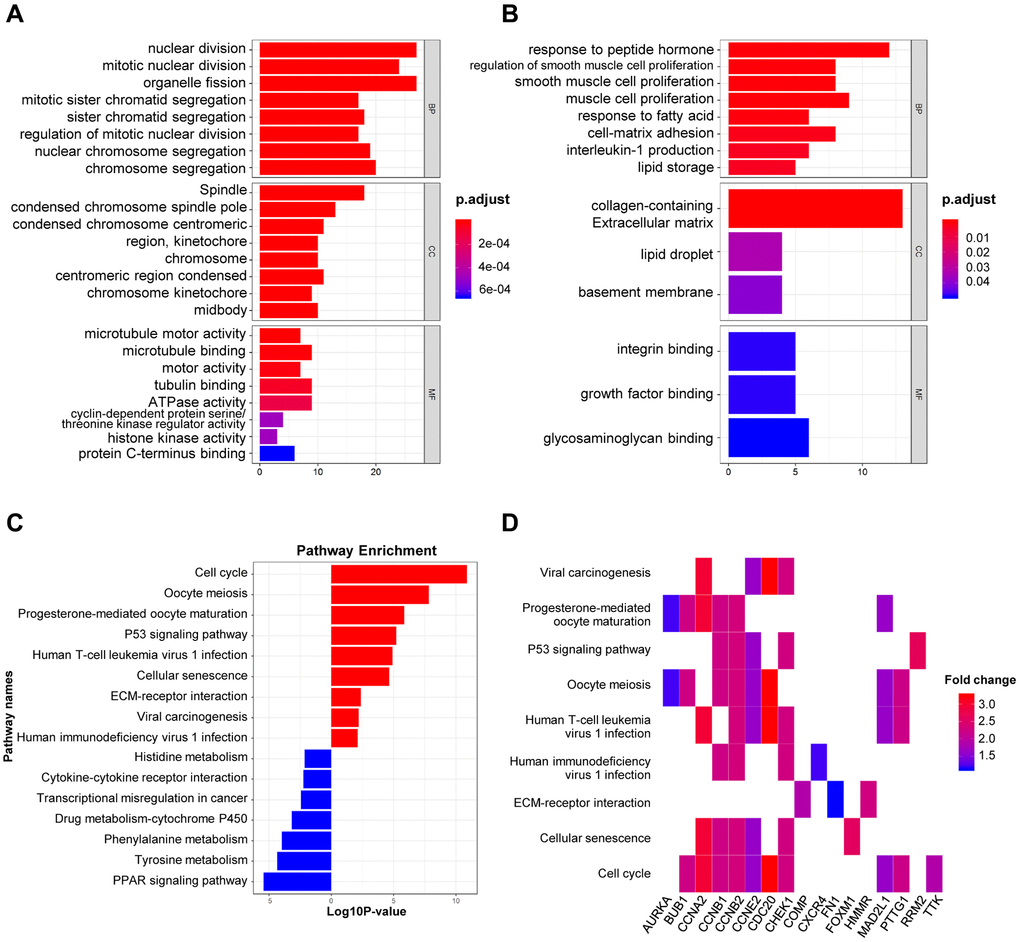
Figure 2.GO and KEGG analysis of DEGs in BRCA. (A–B) The biological processes, cellular components, and molecular functions of 61 up-regulated DEGs (A) and 90 down-regulated DEGs (B) were displayed by GO analysis. (C) The signaling pathways of 151 DEGs were displayed by KEGG analysis. (D) Heatmap of the significant enrichment results in the KEGG pathway.