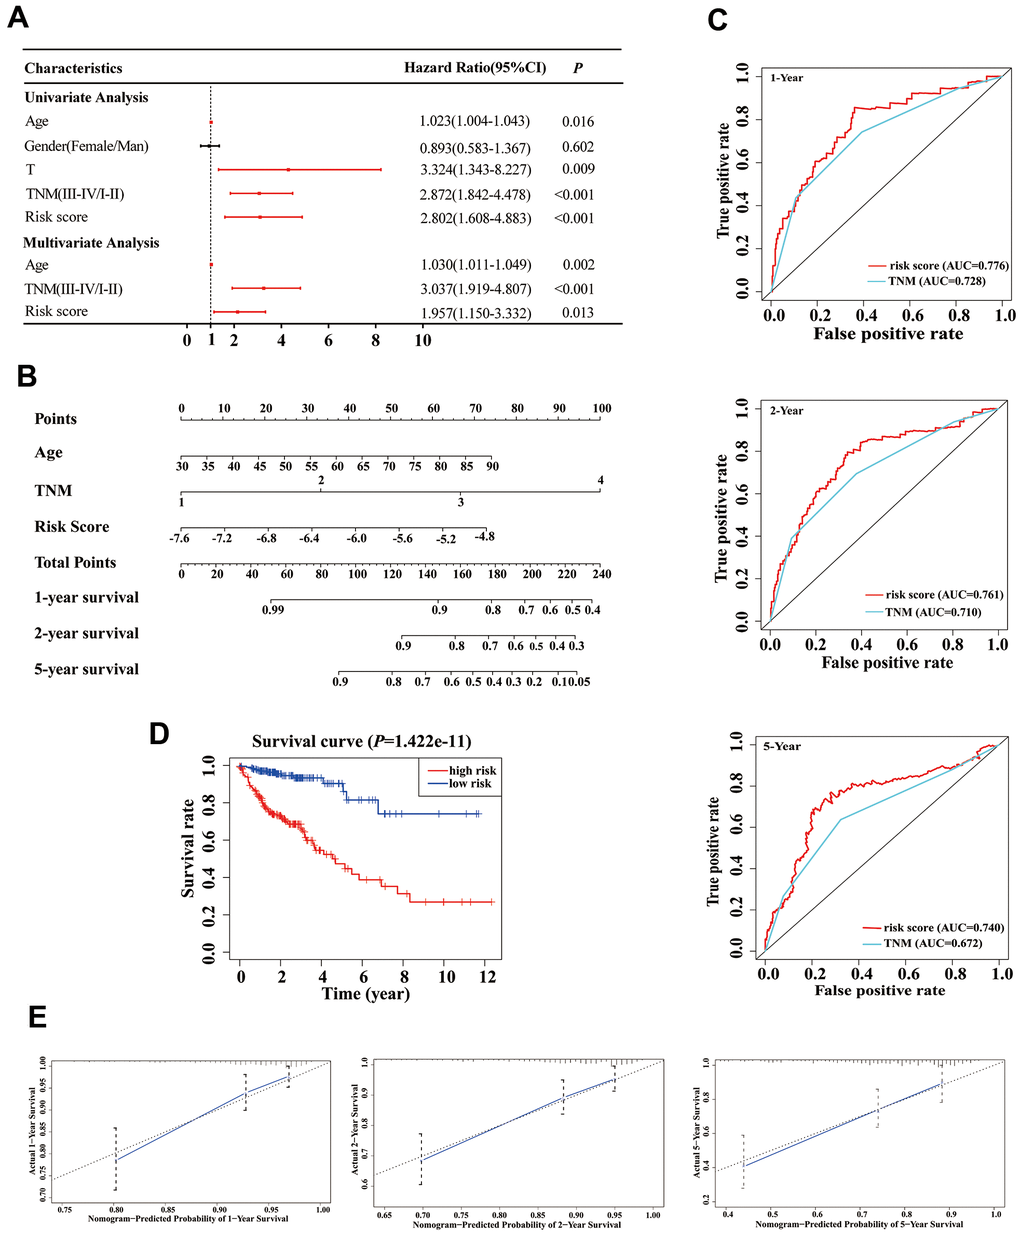
Figure 5.Establishment of an overall survival (OS) nomogram for colon adenocarcinoma (COAD) patients. (A) Univariate and multivariate analyses of risk score and clinical variables. Red solid dots represent significant difference, and black solid dots mean no difference. (B) A nomogram individually predicting OS in COAD patients. (C) The time-dependent ROC of our nomogram and TNM stage in the prediction of prognosis at 1-, 2-, and 5-year time points. (D) The K-M curve of our nomogram. (E) Calibration plot of the nomogram. The predicted and the actual probabilities of OS are plotted using blue solid and black dotted lines, respectively.