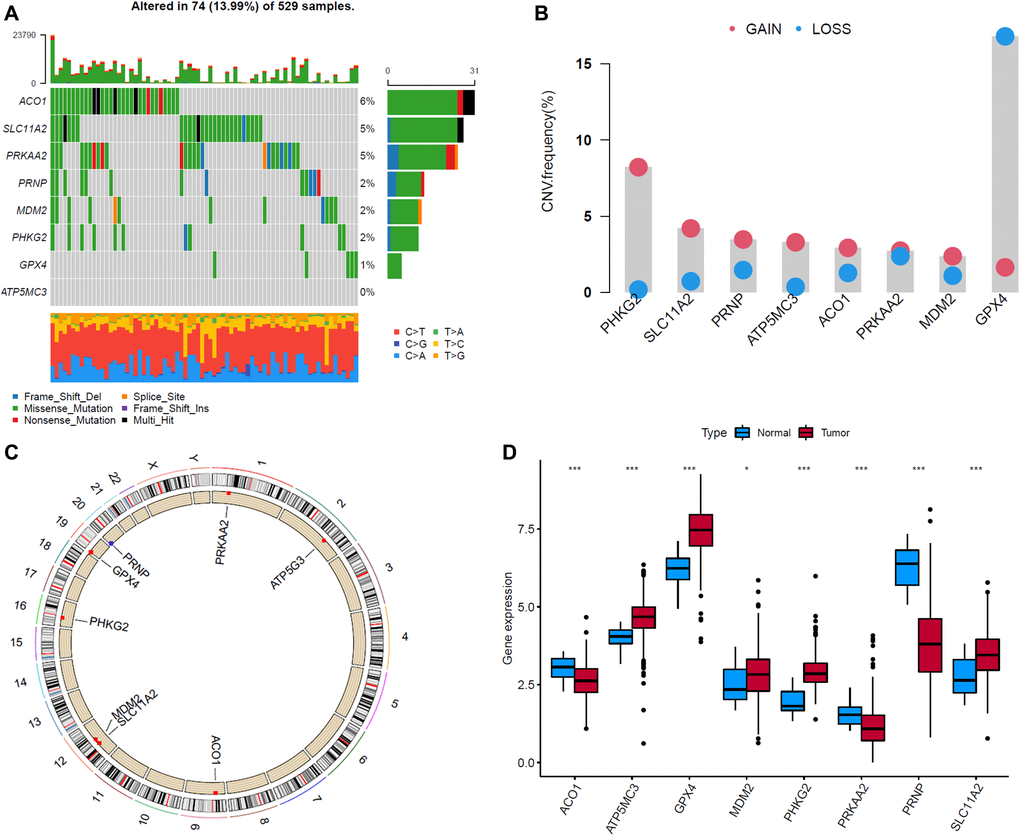
Figure 7.Landscape of genetic and expression variation of eight ferroptosis-related genes (FRGs) in endometrial cancer (EC) samples. (A) The alteration frequency of 8 FRGs in 529 EC samples. Each column represented individual patients. The upper bar plot showed TMB. The number on the right indicated the alteration frequency in each regulator. The right bar plot showed the proportion of each variant type. The stacked bar plot below showed fraction of conversions in each sample. (B) The CNV variation frequency of FRGs in EC samples. The height of the column represented the alteration frequency. The deletion frequency, blue dot; The amplification frequency, red dot. (C) The location of CNV alteration of FRGs on 23 chromosomes. (D) The expression of 8 FRGs between normal tissues and EC tissues. Tumor, red; Normal, blue. The upper and lower ends of the boxes represented interquartile range of values. The lines in the boxes represented median value, and black dots showed outliers. The asterisks represented the statistical p value (*P < 0.05; **P < 0.01; ***P < 0.001).