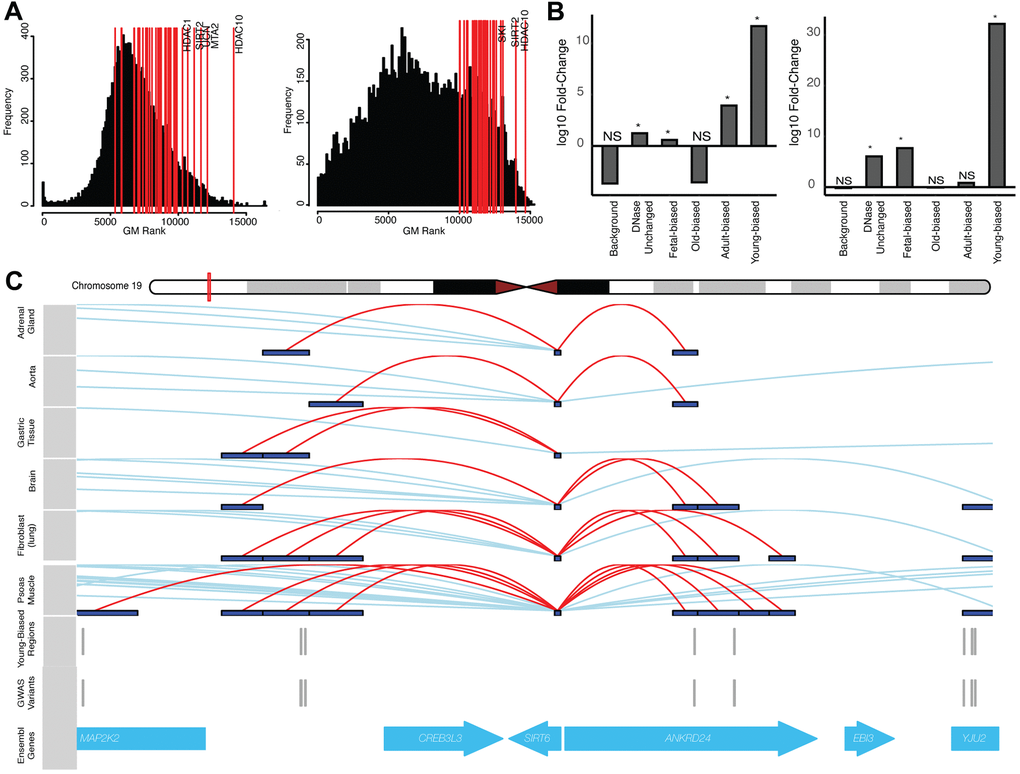
Figure 4.Altered-accessibility regions identify relevant aging biology. (A) (Left) Distribution of cross-disease ranks for all protein-coding genes, when ranking by local variants independent of accessibility data (see Supplementary Methods). Red lines indicate genes within the ‘histone deacetylation’ (HDAC) GO term; top ranked genes (by geometric mean) are indicated. (Right) Similar distribution of cross-disease ranks, ranking genes with variants nearby young-biased regions. Red lines indicate top HDAC genes by rank. (B) (Left) Fold-change of normal cumulative distribution function (CDF) p-values of variants within HDAC gene loci associated with different region sets, relative to CDF test performed using all variants, for cross-disease Z-score metric (see Supplementary Methods). (Right) Similar plot for per-variant LINSIGHT scores. See Supplementary Table 4. (C) Variants directly intersecting young-biased regions which interact with the SIRT6 promoter. (Top) Visualized promoter-capture data [41] across multiple cell-types. (Bottom) Tracks indicating variants which overlap young-biased regions within the SIRT6 gene locus.