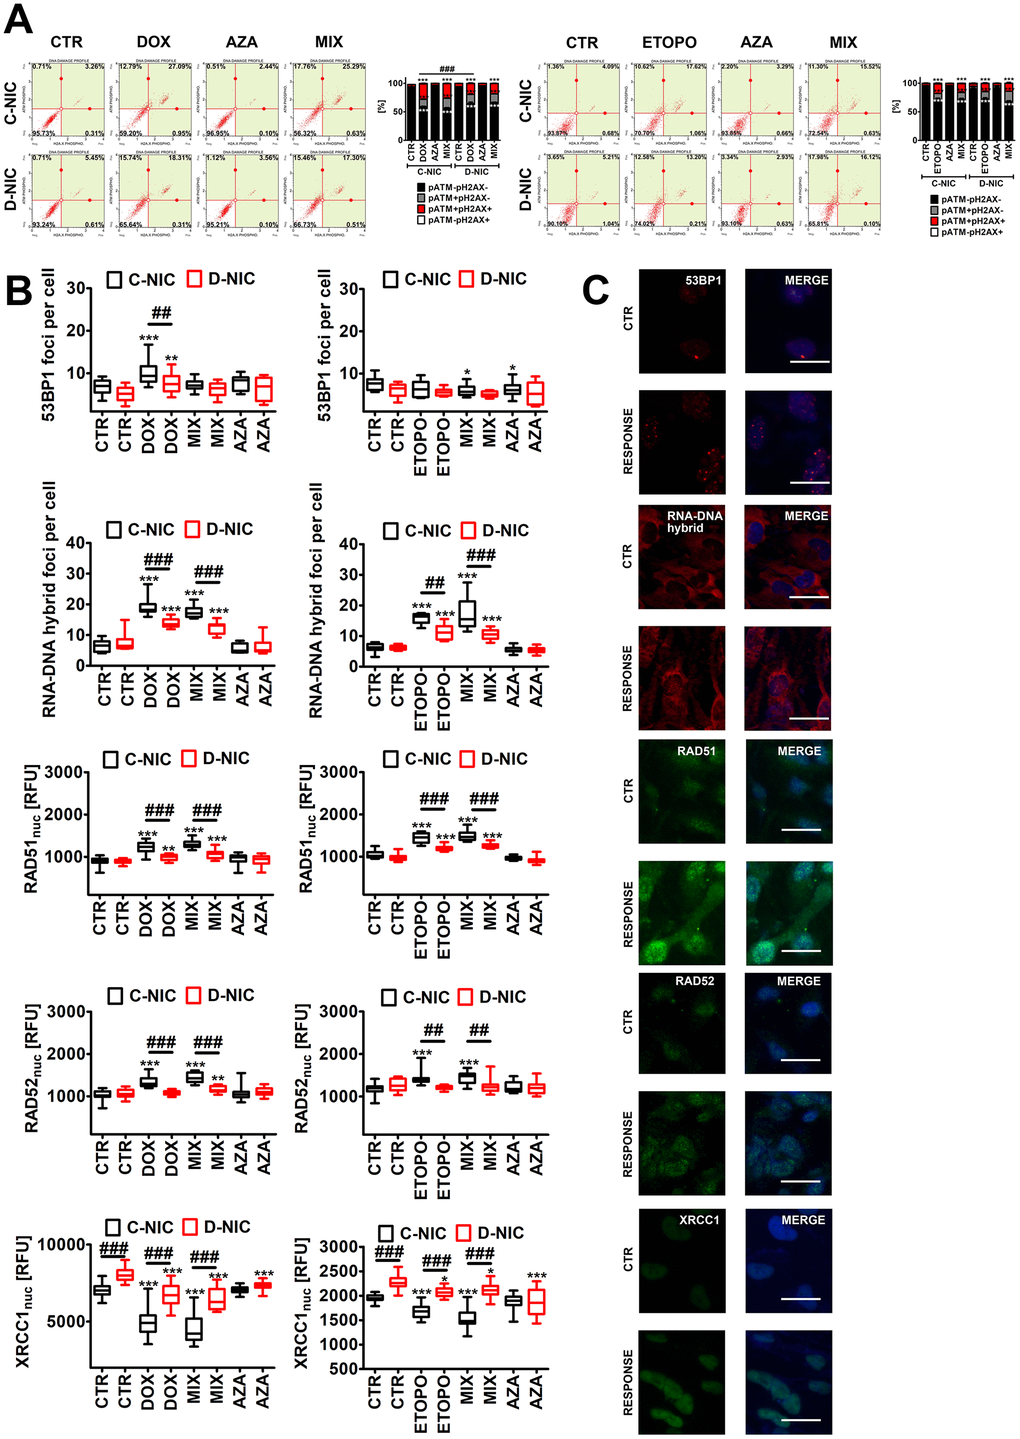
Figure 5.DNMT2/TRDMT1 gene knockout-mediated DNA damage response (DDR) in U-251 MG glioblastoma cells treated with DOX or ETOPO. (A) Activation of ATM and H2AX was evaluated using flow cytometry. Representative dot plots are shown. Bars indicate SD, n = 3, ***p < 0.001 compared to CTR (ANOVA and Dunnett’s a posteriori test), ###p < 0.001 compared to drug-treated C-NIC cells (ANOVA and Tukey’s a posteriori test). (B, C) 53BP1 foci, RNA-DNA hybrid foci, RAD51, RAD52 and XRCC1 immunostaining (red or green). The levels of RAD51, RAD52 and XRCC1 are expressed as relative fluorescence units (RFU). Representative microphotographs are shown, objective 20x, nucleus staining (blue), RESPONSE, representative DOX or ETOPO treatment. Box and whisker plots are shown, n = 3, ***p < 0.001, **p < 0.01, *p < 0.05 compared to CTR (ANOVA and Dunnett’s a posteriori test), ###p < 0.001, ##p < 0.01 compared to C-NIC cells at the same culture conditions (ANOVA and Tukey’s a posteriori test). CTR, control conditions; DOX, doxorubicin treatment; ETOPO, etoposide treatment; AZA, azacytidine treatment; MIX, azacytidine post-treatment; C-NIC, control cells with unmodified levels of DNMT2/TRDMT1 containing control plasmid; D-NIC, cells with DNMT2/TRDMT1 gene knockout containing dedicated DNMT2 double nickase plasmid.