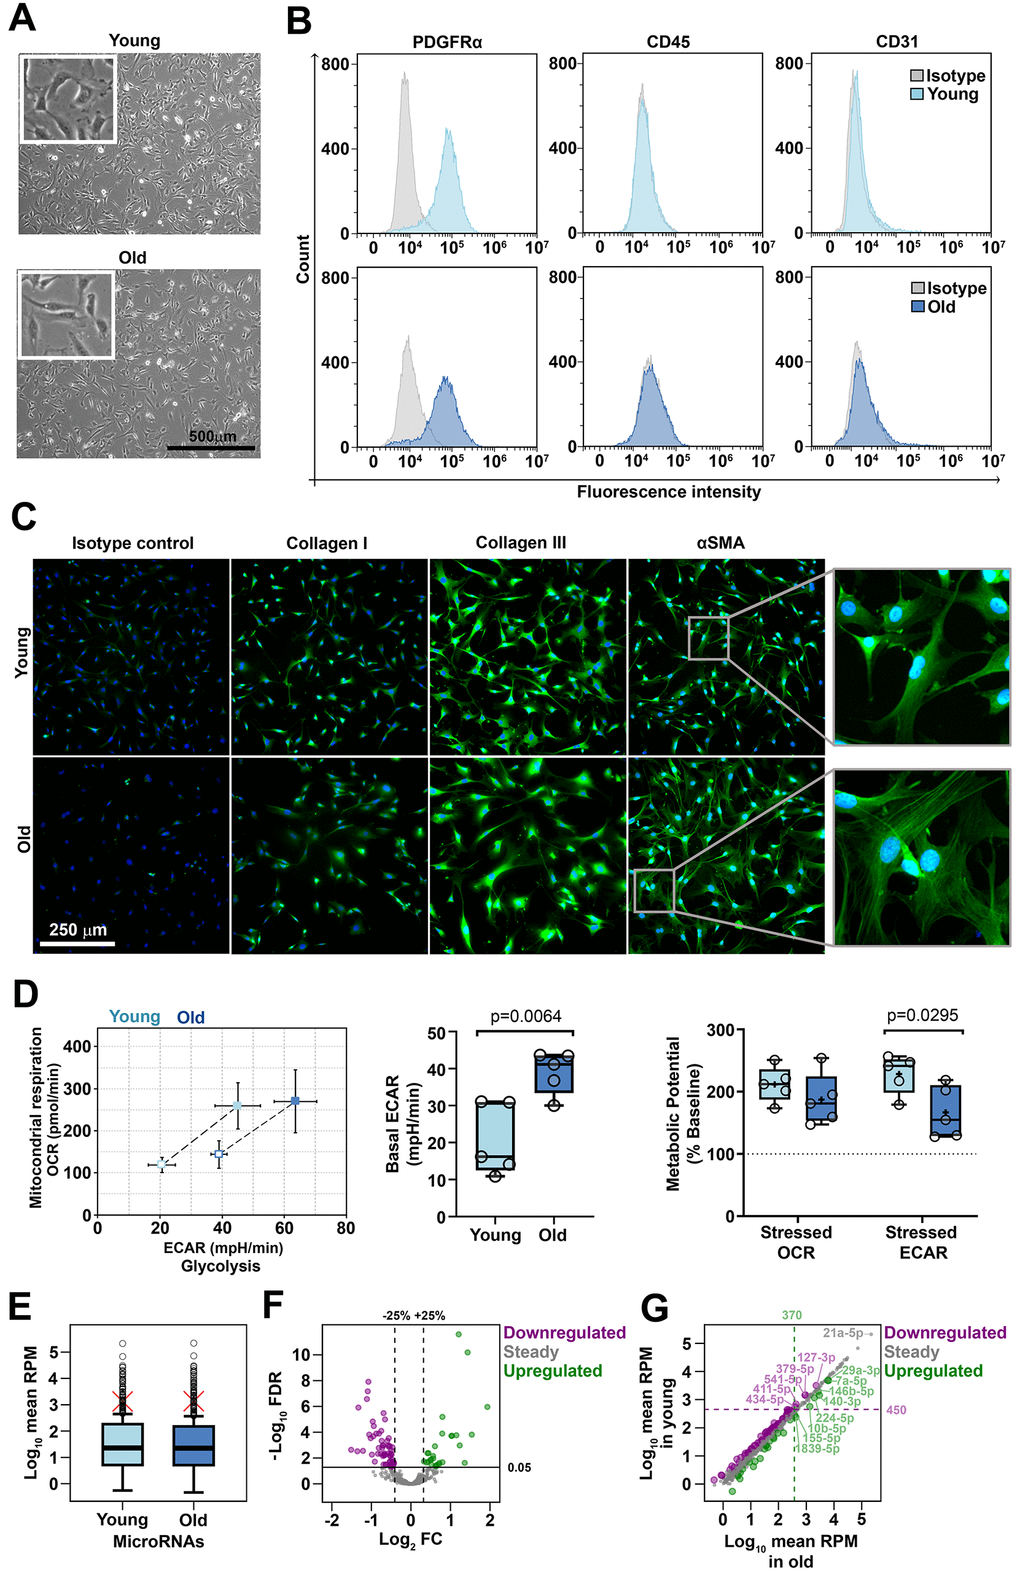
Figure 1.Characterization of cardiac fibroblasts derived from young and old mice (A) Phase-contrast microscopy of cells after 3 days in culture. No morphological differences were identified between young- and old-derived cells. (B) Flow cytometry analysis of young- and old-derived cells after 5 days in culture revealing the presence of PDGFRα and the absence of CD31, CD45. The histograms illustrate representative results of three experiments. (C) Fluorescent microscopy images illustrating the presence of αSMA, collagen I and collagen III. Note the different patterns of SMA in the two groups (inset). The pictures are representative from three experiments. (D) Cell energy phenotypes of young- and old-derived cardiac fibroblasts obtained by using XF Cell Energy Phenotype Report Generator. (E) Distribution of mean expression levels of miRNAs in young and old cardiac fibroblasts. Red crosses mark mean values. Circles mark outliers. (F) Volcano plot showing 530 sequenced miRNAs as steady or differentially expressed (downregulated or upregulated). MiRNAs with FDR < 0.05 were considered differentially expressed. Note that downregulated and upregulated miRNAs had a variation of at least 25% in old compared to young cardiac fibroblasts. (G) The expression levels of miRNAs in young versus old cardiac fibroblasts. Upregulated miRNAs with a mean RPM value in old cardiac fibroblasts over 370 and downregulated miRNAs with a mean RPM value in young cardiac fibroblasts over 450 were depicted as outliers. FDR, false discovery rate (p-value adjusted for multiple testing by the Benjamini-Hochberg procedure); FC, fold change (miRNA in old compared to young cardiac fibroblasts); RPM, reads per million.