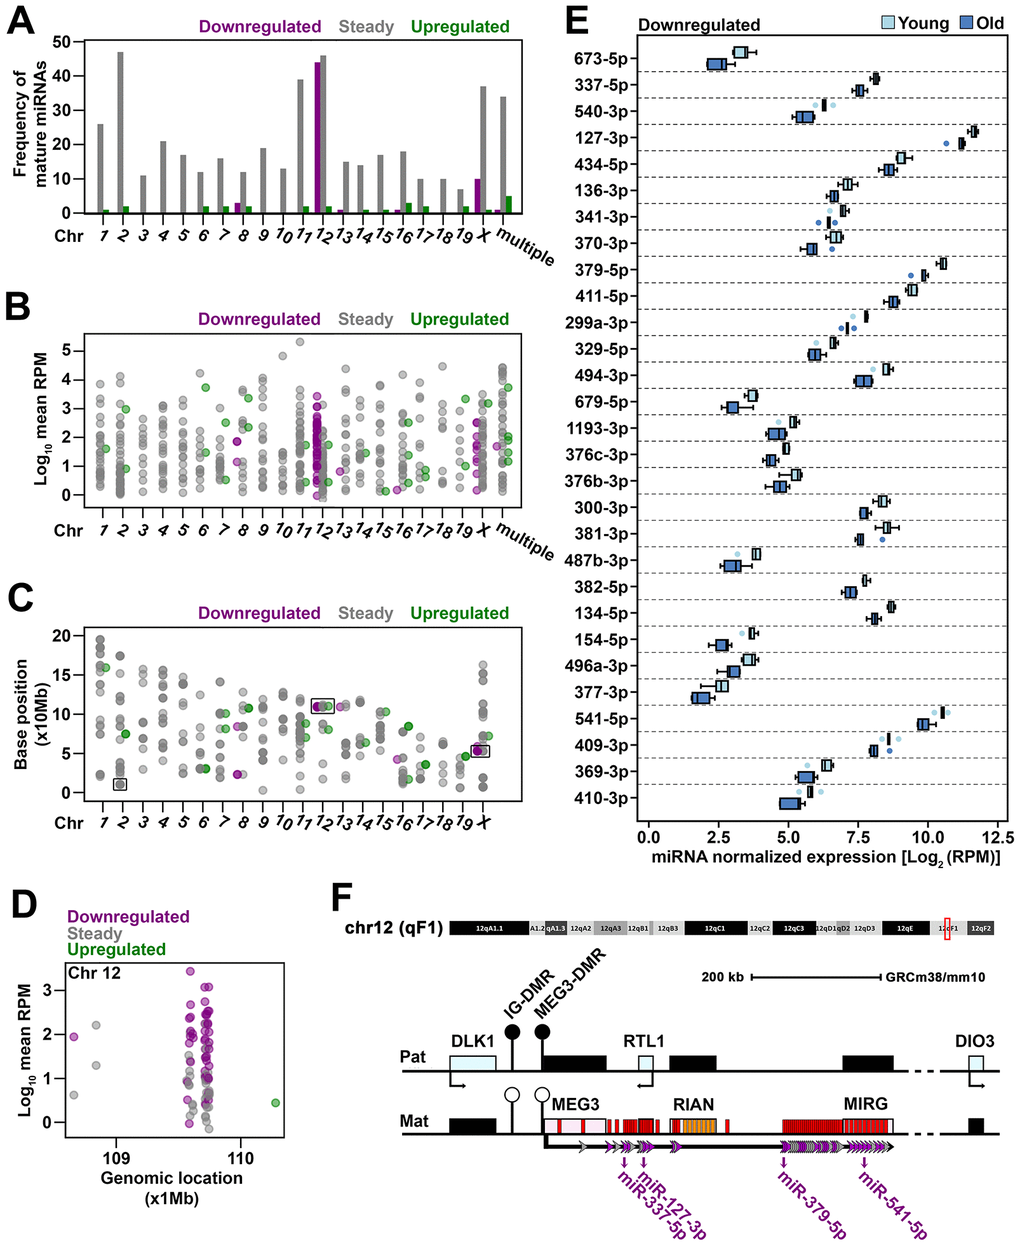
Figure 2.Genomic distribution of miRNAs sequenced in old cardiac fibroblasts (A) The frequency of mature miRNAs mapped to each mouse chromosome or to multiple chromosomes. (B) The expression level of mature miRNAs that mapped to each chromosome or to multiple chromosomes. (C) The genomic location of mature miRNAs represented by the position at which the corresponding gene begins. Mature miRNAs with multiple genomic locations were not depicted due to unknown source of expression given multiple loci. (D) The genomic location and expression level of miRNAs clustered on chromosome 12. (E) The expression of downregulated mature miRNAs mapped to Meg3-Mirg locus in old and young cardiac fibroblasts. When both -3p and -5p strands were detected, the one with greater expression was considered as representative for the respective miRNA gene. MiRNAs were ordered based on their location within the Meg3-Mirg cluster. (F) Schematic representation of the Meg3-Mirg locus as part of the Dlk1-Dio3 paternally imprinted locus. Meg3-Mirg locus is expressed from the maternal allele and comprises only non-coding RNAs, i.e. lncRNA (Meg3, Rian, Mirg), snoRNAs (orange bars) and miRNAs (red bars). MiRNA genes expressed in cardiac fibroblasts are illustrated as arrows: grey arrows depict steady miRNA, and purple arrows show downregulated miRNAs. MiRNAs chosen as representative for Meg3-Mirg cluster are emphasized. Additional information is shown in Supplementary Figure 2.
Figure 2 — miRNAs generated from Meg3-Mirg locus are downregulated during aging | Aging