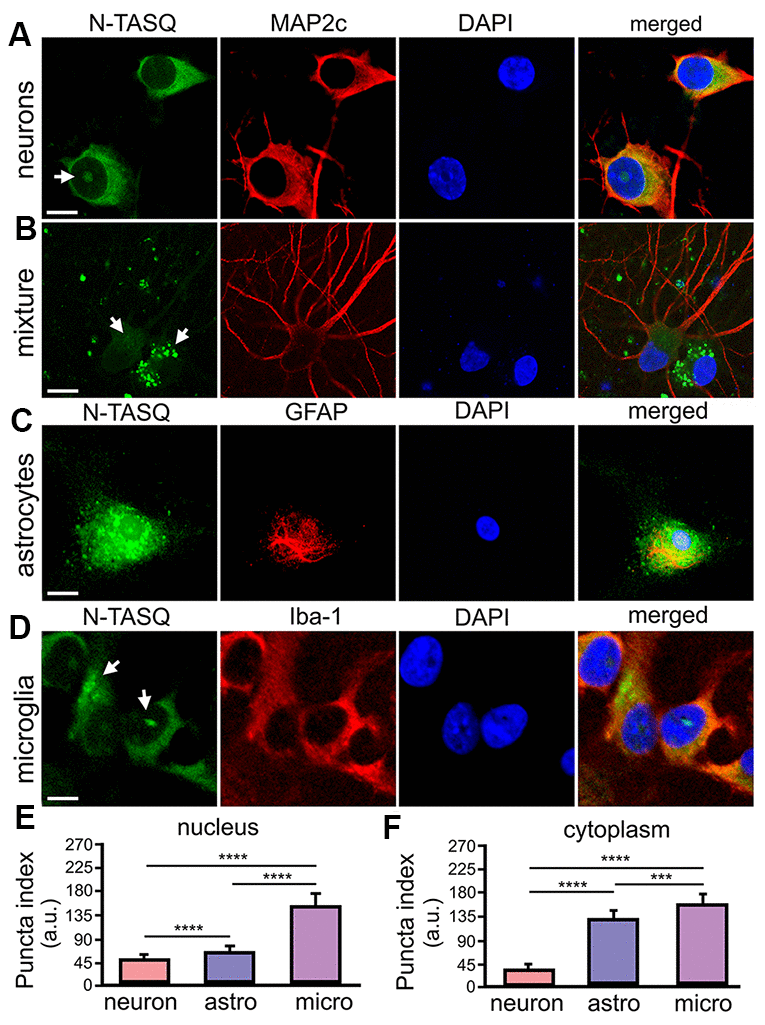
Figure 1.G4 landscapes vary among primary neurons, astrocytes, and microglia. (A) Primary cortical neurons (14 DIV) were fixed and stained with 25 μM N-TASQ, antibodies against MAP2c, and the nuclear dye DAPI, and imaged with a confocal microscope. Note the N-TASQ-positive structure in the nucleus of the cell on the left (depicted with arrow). Scale bar, 5 μm. (B) Primary cortical cultures were stained and imaged as in (A). Note the MAP2c-positive neurons on the right that contain small N-TASQ-positive puncta in the cytoplasm (depicted with arrow). Note the MAP2c-negative cell on the right that contains many N-TASQ-positive puncta in the cytoplasm (depicted with arrow). Scale bar, 10 μm. (C) Cultured primary astrocytes were fixed, stained with 25 μM N-TASQ, antibodies against GFAP, and DAPI, and imaged with a confocal microscope. Note numerous N-TASQ-positive structures in the nucleus and cytoplasm. Scale bar, 10 μm. (D) Cultured primary microglial cells were fixed, stained with 25 μM N-TASQ, antibodies against Iba-1, and DAPI, and imaged with a confocal microscope. Note N-TASQ-positive structures in the nuclei and the cytoplasm (depicted with arrows). Scale bar, 5 μm. (E) The nuclear puncta index of the N-TASQ staining was analyzed in the nuclei of cells from (A), (C, D). The Kruskal-Wallis test was used. ****p<0.0001. 120 cells per cell type were analyzed, and results were pooled from three independent experiments. (F) The cytoplasmic puncta index of the N-TASQ staining was analyzed in the cytoplasm of cells from (A), (C, D). The Kruskal-Wallis test was used. ****p<0.0001, ***p=0.0001. 120 cells per cell type were analyzed, and results were pooled from three independent experiments.