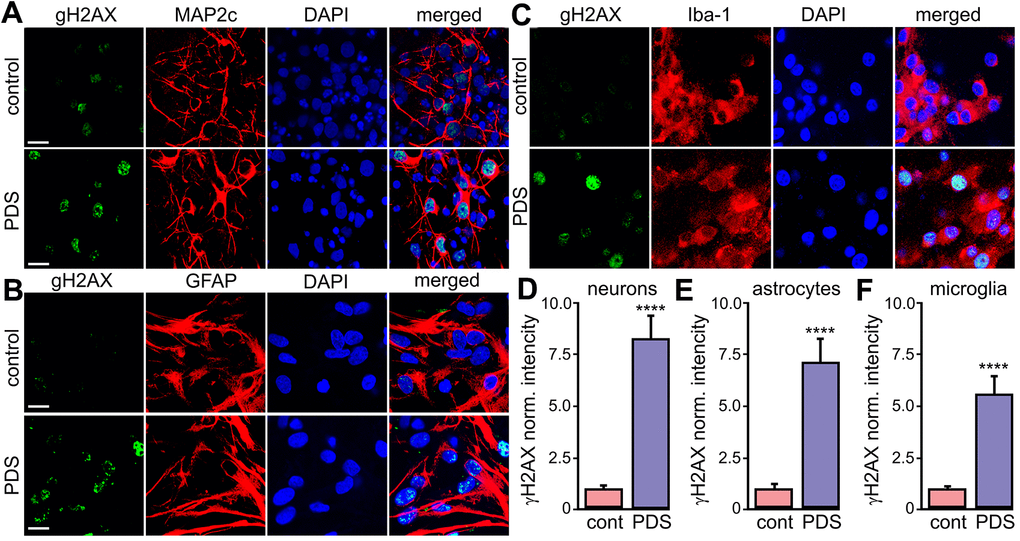
Figure 3.PDS induces DNA DSBs in primary neurons, astrocytes, and microglia. (A) Primary cortical neurons were treated with a vehicle (upper panel; control) or with 2 μM PDS (lower panel; PDS) overnight, fixed, and stained for a marker of DNA DSBs phosphorylated histone H2A variant X, γH2A.X (green), MAP2c (red), and with the nuclear DAPI dye (blue). Samples were imaged with a confocal microscope. Scale bar is 10 μm. (B) Primary astrocytes were treated with a vehicle (upper panel; control) or with 2 μM PDS (lower panel; PDS) overnight, fixed, and stained for γH2A.X (green), GFAP (red), and with DAPI (blue). Samples were imaged with a confocal microscope. Scale bar is 10 μm. (C) Primary microglial cells were treated with a vehicle (upper panel; control) or with 2 μM PDS (lower panel; PDS) overnight, fixed, and stained for γH2A.X (green), Iba-1 (red), and with the nuclear DAPI dye (blue). Samples were imaged with a confocal microscope. Scale bar is 10 μm. (D) The γH2A.X intensities were measured in images from (A) and normalized (arbitrary units). ****p<0.0001 (t-test). 100 neurons were analyzed from three independent experiments. (E) The γH2A.X intensities were measured in images from (B) and normalized (arbitrary units). ****p<0.0001 (t-test). 100 astrocytes were analyzed from three independent experiments. (F) The γH2A.X intensities were measured in images from (C) and normalized (arbitrary units). ****p<0.0001 (t-test). One hundred microglial cells were analyzed from three independent experiments.