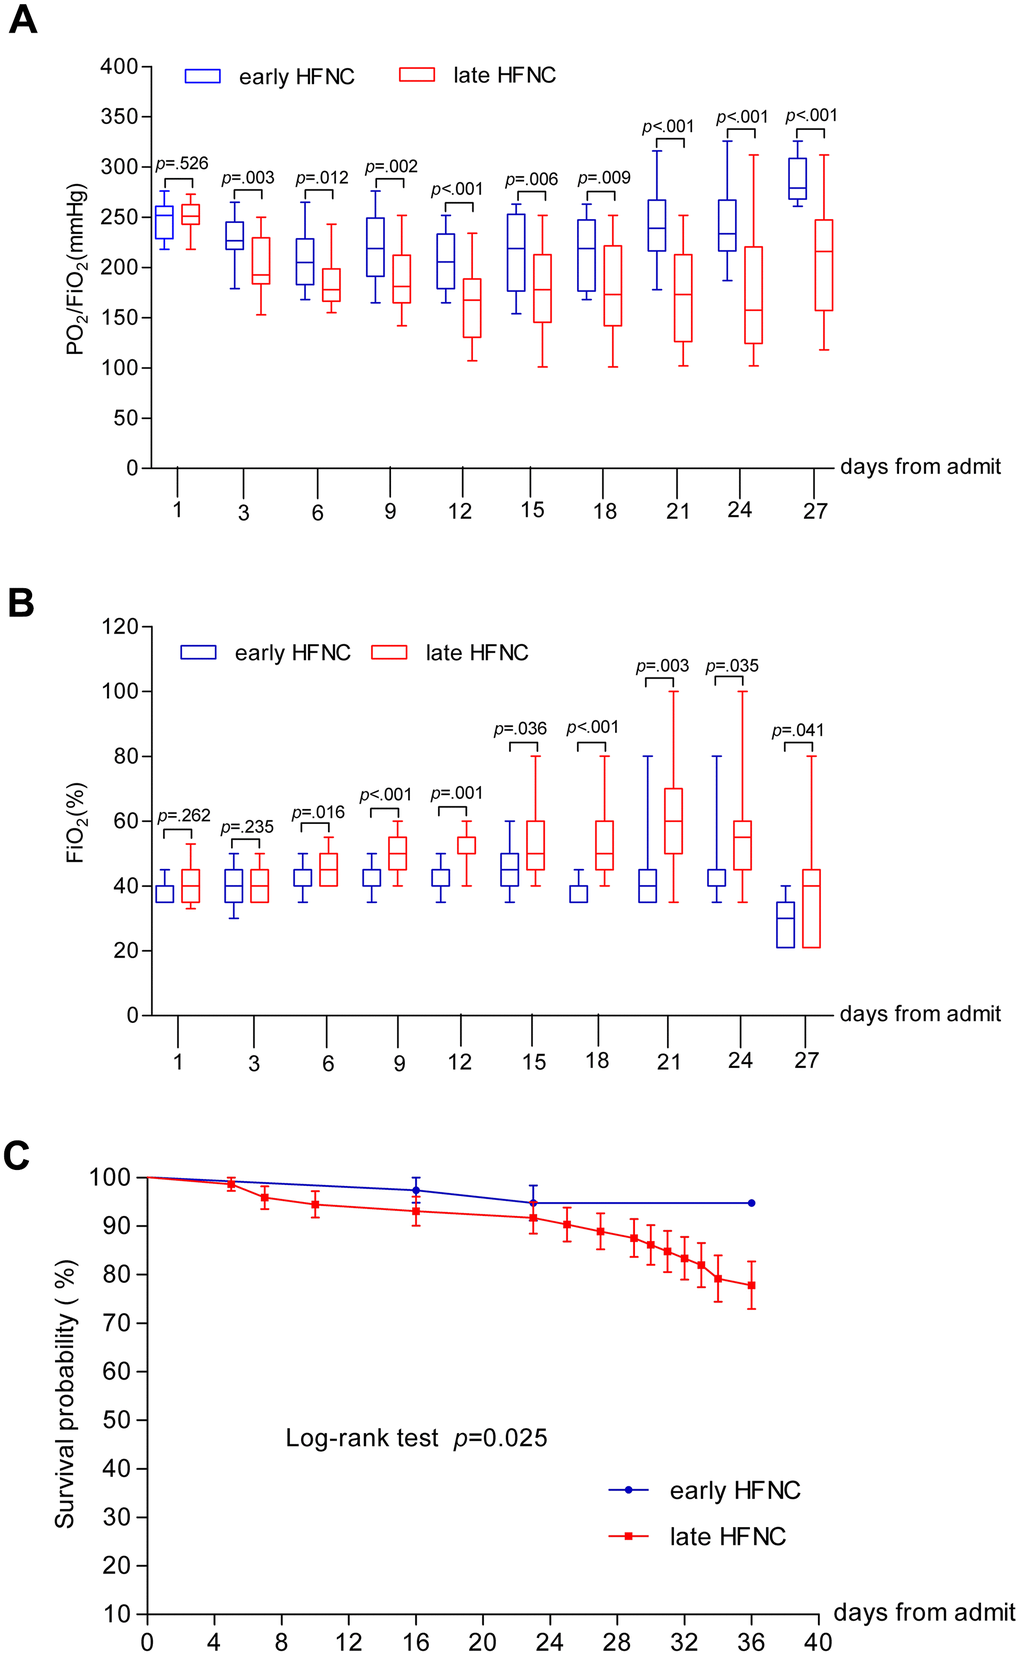
Figure 3.Dynamic changes of PaO2/FiO2 and FiO2 and survival probability in patients with COVID-19. Figure shows temporal changes in PaO2/FiO2 (A) and FiO2 (B), and survival probability (C). COVID-19=coronavirus disease 2019, PaO2/FiO2=Ratio of arterial oxygen partial pressure to fraction inspired oxygen concentration, FiO2 =fraction inspired oxygen concentration. The horizontal lines represent the median value in each group in A and B.