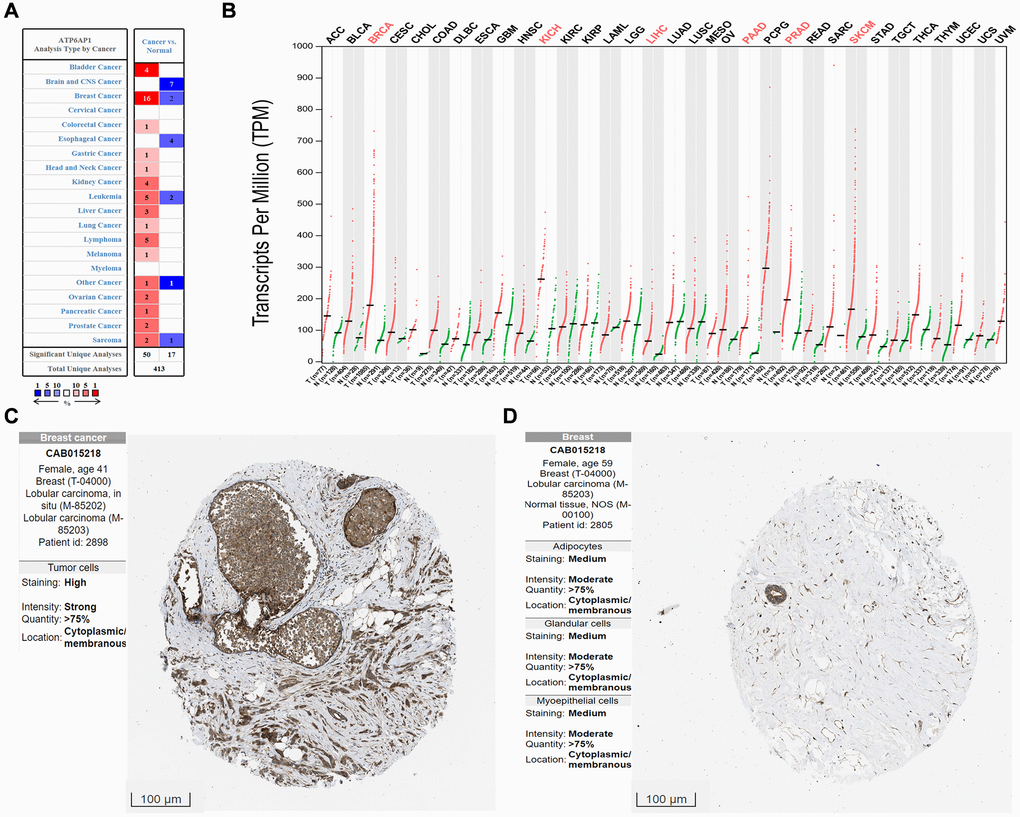
Figure 1.ATP6AP1 levels in cancer tissues compared with normal tissues. (A) ATP6AP1 mRNA levels in samples from the Oncomine database. The numbers in the colored squares represent the number of involved studies. The different colors correspond to different ATP6AP1 levels, with red representing high expression and blue representing low expression. The darker the red color, the higher the expression, and the darker the blue color, the lower the expression. (B) ATP6AP1 mRNA levels in samples from the GEPIA database. Red indicates significant results. (C, D) ATP6AP1 protein levels in normal and cancerous breast tissues based on immunohistochemistry data from the HPA database (antibody: CAB015218, provided by Origene. Dilution: 1:30).