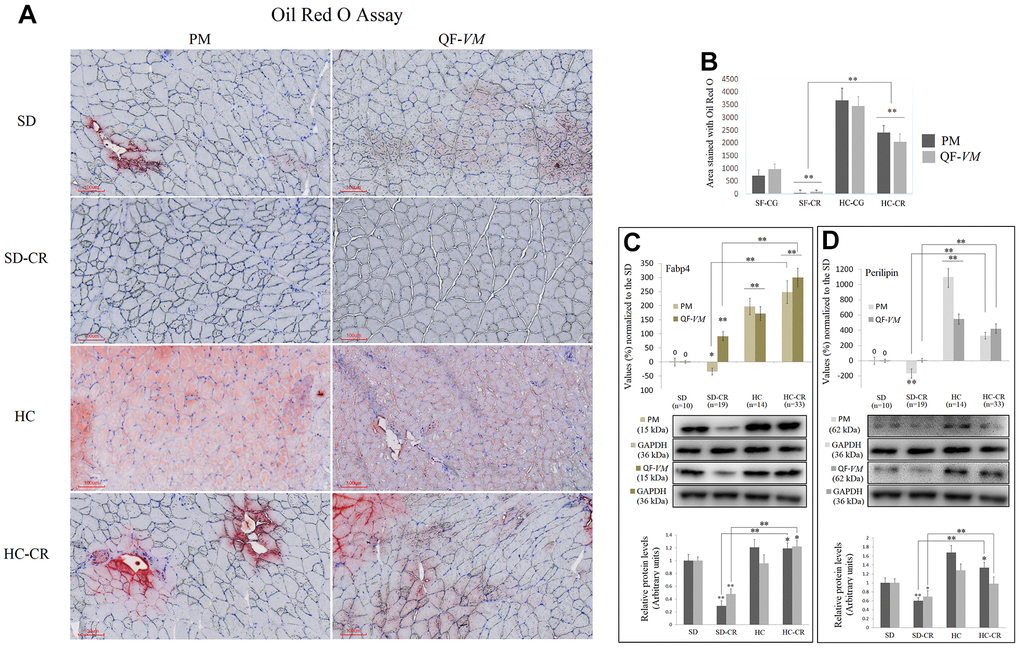
Figure 3.Lipid content determination in PM and QF-VM of the experimental animal model. Representative images of lipid content stained with the oil red O technique (A). Scale bar: 100 μm. SD (n=6), SD-CR (n=8), HCD (n=9), and HCD-CR (n=12). The total area stained with Oil red O (B). Fabp4 (C) and Perilipin (D) were used to predict inter- (INTM) and intra-myocellular (IM) fat infiltration. Fabp4 and Perilipin were analyzed by qPCR (mRNA) and expressed as %, the SD value was set to 0, and the compared samples were normalized to this level. Positive % values represent upregulation. Negative values represent downregulation. Protein expression of Fabp4 and Perilipin was obtained by Western Blot analysis and quantified with Image Lab 6.1 software. SD expression was set to 1 and the relative protein levels were normalized as a ratio of GAPDH expression. The data are the mean ± s.d. *P < 0.05; **P < 0.01 vs SD, unless otherwise specified.