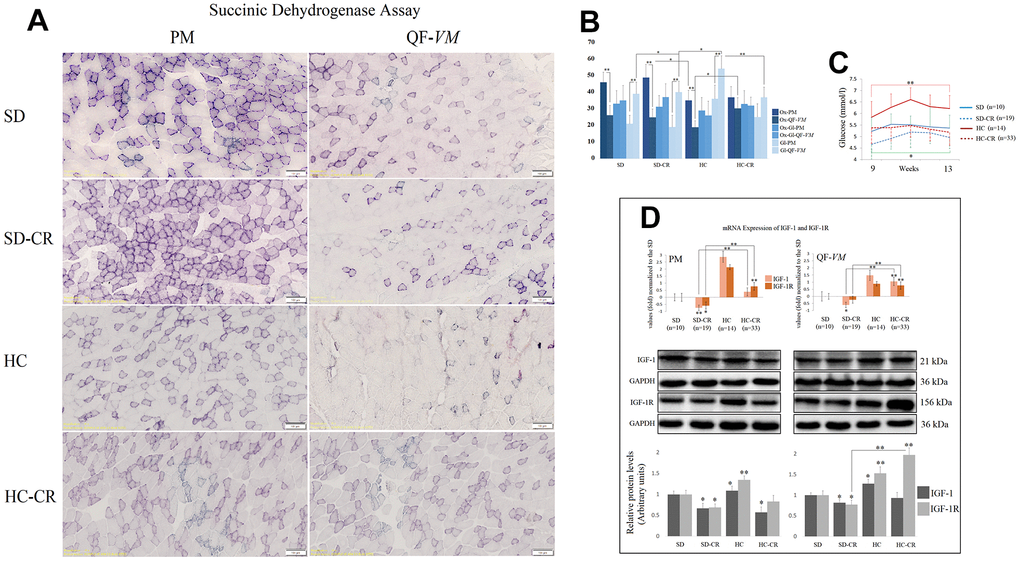
Figure 4.Metabolic characterization of PM and QF-VM in the experimental animal model. Representative images of SDH staining in muscle fibers of PM and QF-VM in the different groups (A). Scale bar: 100 μm. SD (n=6), SD-CR (n=8), HCD (n=9), and HCD-CR (n=12). The total area stained with Oil red O (B). Dark stained fibers were classified as oxidative (Ox); intermediate stained fibers were classified as oxidative-glycolytic (Ox-Gl); and very lightly or non-stained fibers were classified as glycolytic (Gl). Comparison of the blood glucose levels of mice during week 9 to 13 of the dietary restriction (C). IGF-1 and IGF-1R were analyzed by qPCR and Western Blot analysis (D). mRNA was expressed as fold, the SD value was set to 0, and the compared samples were normalized to this level. Positive values represent upregulation. Negative values represent downregulation. Protein expression of IGF-1 and IGF-1R was obtained by Western Blot analysis and quantified with Image Lab 6.1 software. SD expression was set to 1 and the relative protein levels were normalized as a ratio of GAPDH expression. The data are the mean ± s.d. *P < 0.05; **P < 0.01 vs SD, unless otherwise specified.