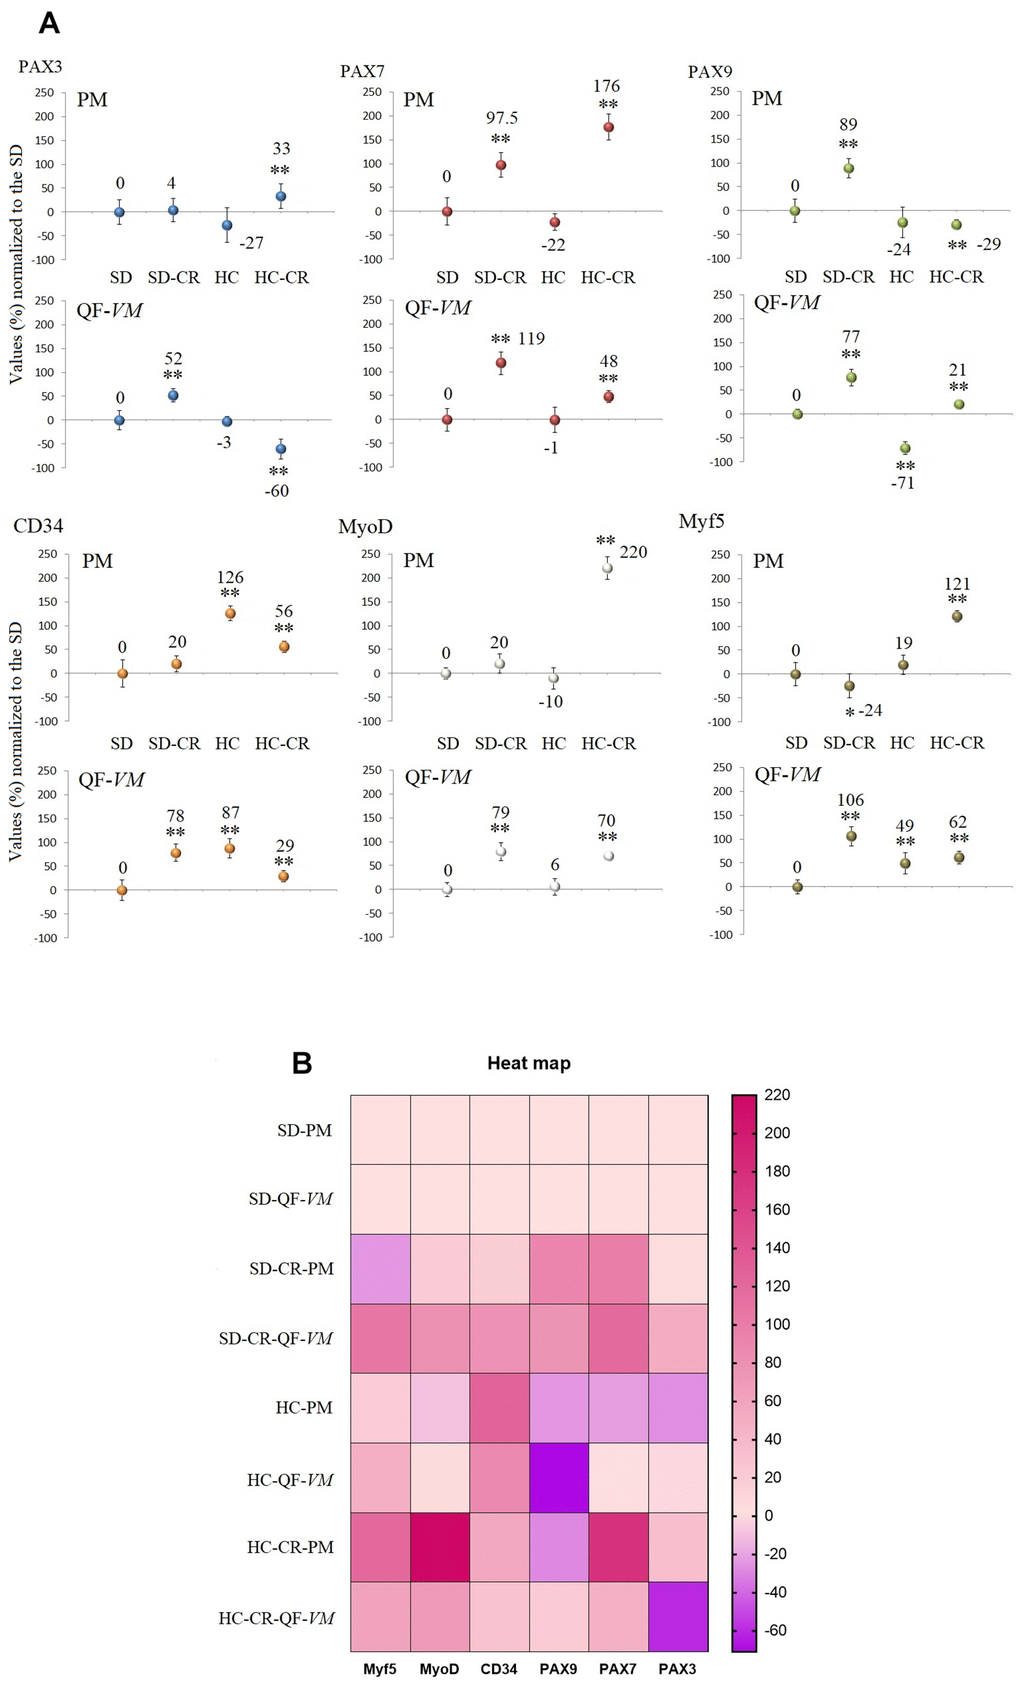
Figure 5.Gene expression of satellite markers. cDNA from PM and QF-VM was obtained with a Takara RR047Q kit. qPCR was performed with 100 ng of target DNA to measure PAX3, PAX7, PAX9, CD34, MyoD, Myf5, and 18s rRNA (reference gene) expression (A). For each gene expressed as percentage (%), the SD value was set to 0, and the compared samples were normalized to this level. Positive values represent upregulation. Negative values represent downregulation. Each marker was analyzed with SYBR Green fluorescence detection, and the transcript levels were normalized to those of the endogenous control 18s rRNA. The data are the mean ± s.d. *P < 0.05; **P < 0.01 vs SD. A hierarchical clustering illustration for the up/down-regulation of genes analyzed from RT-PCR array data. The right bar depicts the colors for upregulation and downregulation expressed as a % (B).