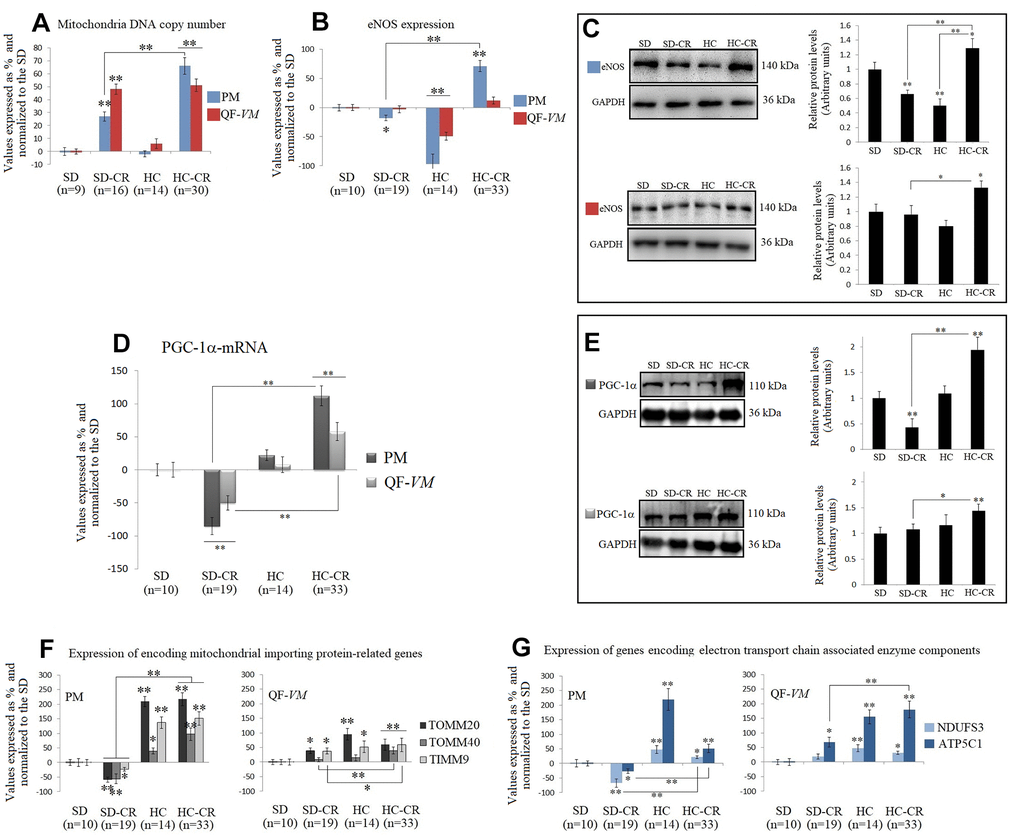
Figure 6.Mitochondrial DNA copy numbers and the expression of mitochondrial biogenesis-related activators in mice subjected to CR. Mitochondrial DNA copy number (A) was analyzed with the Detroit-Mouse-mt-DNA analysis kit (Supplementary Material, 1). For each group, the value was expressed as a percentage (%); the SD value was set to 0, and the rest of the groups were normalized to this level for comparison. eNOS (B, C) and PGC-1α (D, E) were analyzed at the transcriptional and translational levels. TOMM20, TOMM40, TIMM9 (F), and NDUFS3 and ATP5C1 (G), were analyzed at the transcriptional level. For the qPCR assay, each primer was analyzed with SYBR Green fluorescence detection and the transcript levels, expressed as a %, were normalized to those of the endogenous control 18s rRNA. Protein expressions were obtained by Western Blot analysis and quantified with Image Lab 6.1 software. SD expression was set as 1 and the relative protein levels were normalized as a ratio of GAPDH expression. The data are the mean ± s.d. *P < 0.05; **P < 0.01 vs SD, unless otherwise specified.
Figure 6 — The consequences of a high-calorie diet background before calorie restriction on skeletal muscles in a mouse model | Aging