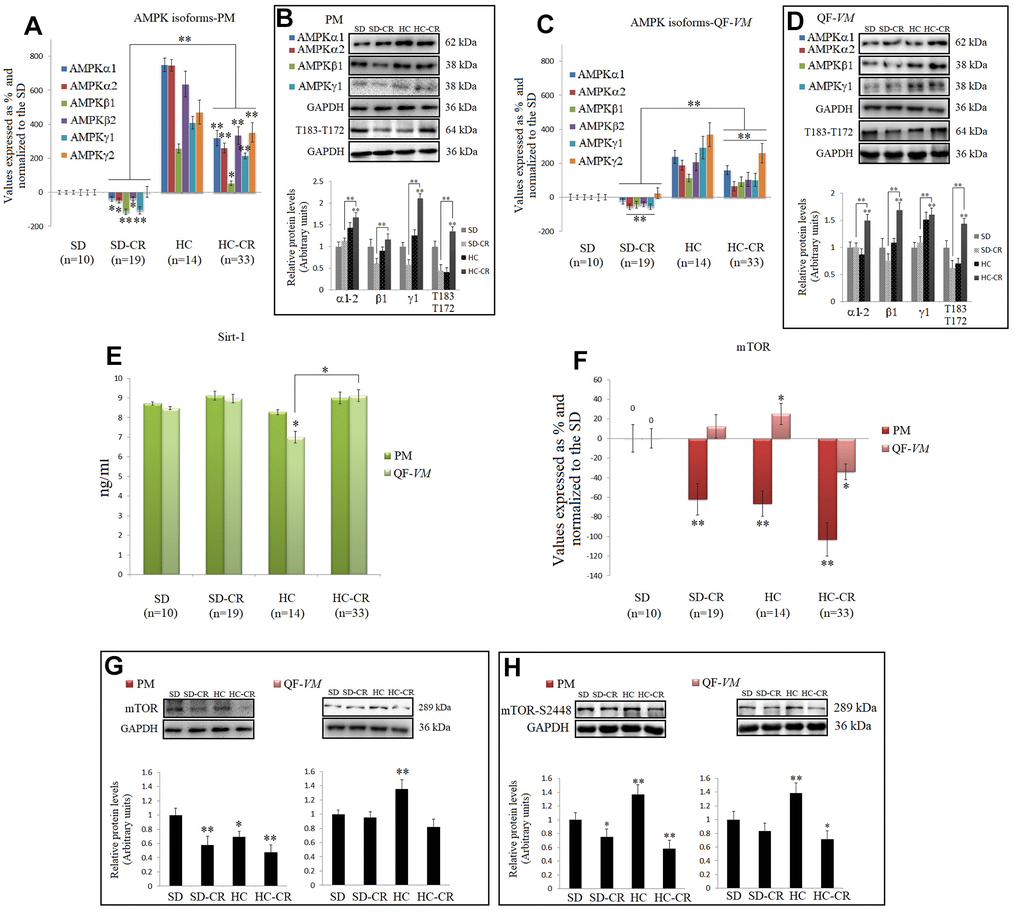
Figure 8.CR and the AMPK-SIRT1-mTOR network. AMPKs were analyzed by qPCR (mRNA levels) and Western Blot (protein levels) in pectoralis major (PM) (A, B) and quadriceps femoris vastus medialis (QF-VM) (C, D). SIRT1 was analyzed in PM and QF-VM (E) with the Mouse NAD-Dependent Deacetylase Sirtuin-1 (SIRT1) ELISA Kit (CUSABIO) for quantitative determination, according to the assay kit protocol (Supplementary Material 3). Values are expressed in ng/ml. mTOR mRNA in PM and QF-VM (F). Immunoblot results and protein expression of mTOR (G) and mTOR-S2448 (H) in PM and QF-VM. For the qPCR assay, each primer was analyzed with SYBR Green fluorescence detection and the transcript levels, expressed as a %, were normalized to those of the endogenous control 18s rRNA. Protein expressions were obtained by Western Blot analysis and quantified with Image Lab 6.1 software. SD expression was set as 1 and the relative protein levels were normalized as a ratio of GAPDH expression. The data are the mean ± s.d. *P < 0.05; **P < 0.01 vs SD, unless otherwise specified.