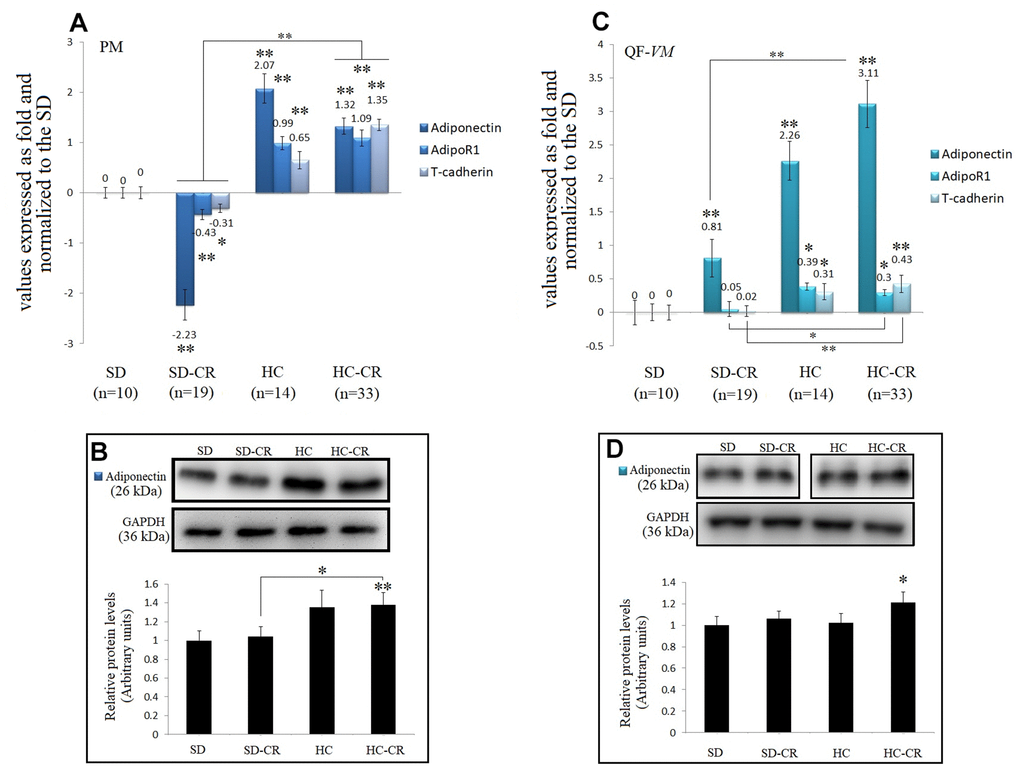
Figure 9.Expression of Adiponectin and Adiponectin-receptors. The mRNA levels of adiponectin, AdipoR1, and T-cadherin in pectoralis major (PM) (A). Immunoblot results and protein expression of adiponectin in PM (B). mRNA levels of adiponectin, AdipoR1, and T-cadherin in quadriceps femoris vastus medialis (QF-VM) (C). Immunoblot results and protein expression of adiponectin in QF-VM (D). Adiponectin, AdipoR1, T-cadherin, and 18s rRNA (reference gene) transcripts were analyzed by qPCR. Significant differences between groups are expressed as fold change values. For each gene expressed as a fold change, the SD value was set to 0, and the compared samples were normalized to this level. Positive values represent upregulation. Negative values represent downregulation. The fold changes are defined directly in terms of ratios. Each marker was analyzed with SYBR Green fluorescence detection, and the transcript levels were normalized to those of the endogenous control 18s rRNA. Protein expression of adiponectin in PM and QF-VM was obtained by Western Blot analysis and quantified with Image Lab 6.1 software. SD expression was set to 1 and the relative protein levels were normalized as a ratio of GAPDH expression. The data are the mean ± s.d. *P < 0.05; **P < 0.01 vs SD, unless otherwise specified.