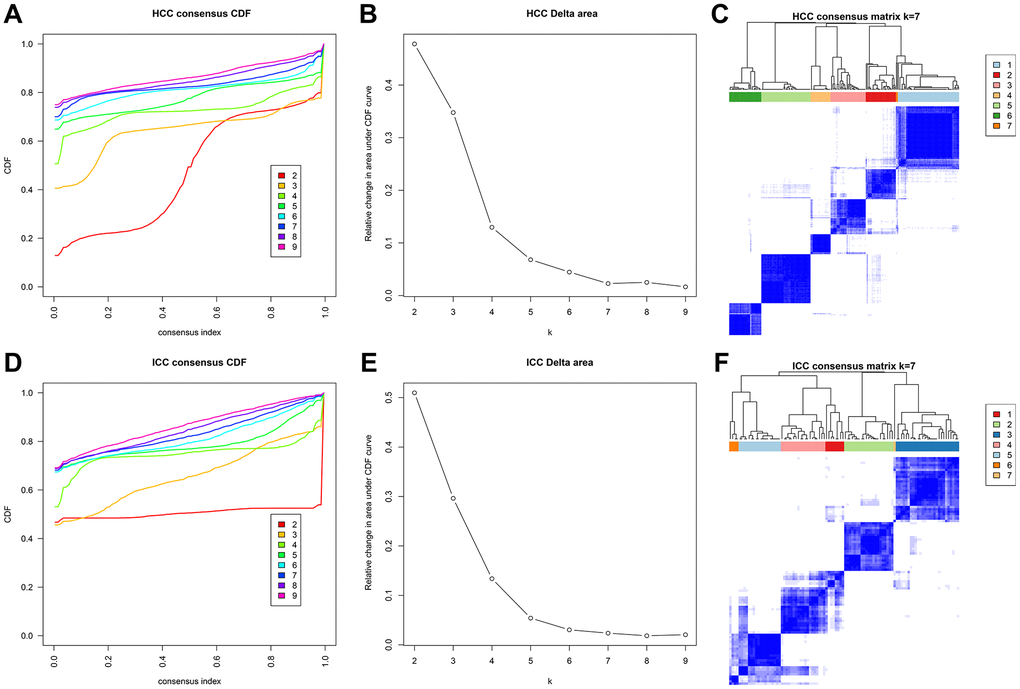
Figure 5.Methylation typing based on independent prognostic sites. Consensus cumulative distribution function (CDF) of HCC (A) and ICC (D). The X-axis represents the consensus index, and the Y-axis represents the CDF curve. The area under the CDF curve for each category in HCC (B) and ICC (E). The X-axis represents the category number k, and the Y-axis represents the CDF curve. Consensus matrix in HCC (C) and ICC (F). Different clusters are annotated with indicated numbers and colors. Color gradients in matrix represent consensus values, white corresponds to 0 and dark blue to 1.