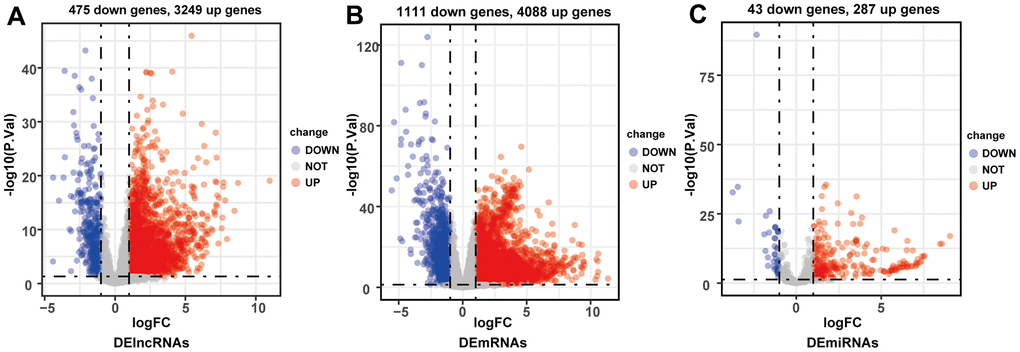
Figure 2.Volcano plots of differentially expressed lncRNAs (A), mRNAs (B) and miRNAs (C). Red plots represented up-regulated genes and green ones represented down-regulated ones. Black plots were genes that did not reach the criteria of differentially expressed genes.