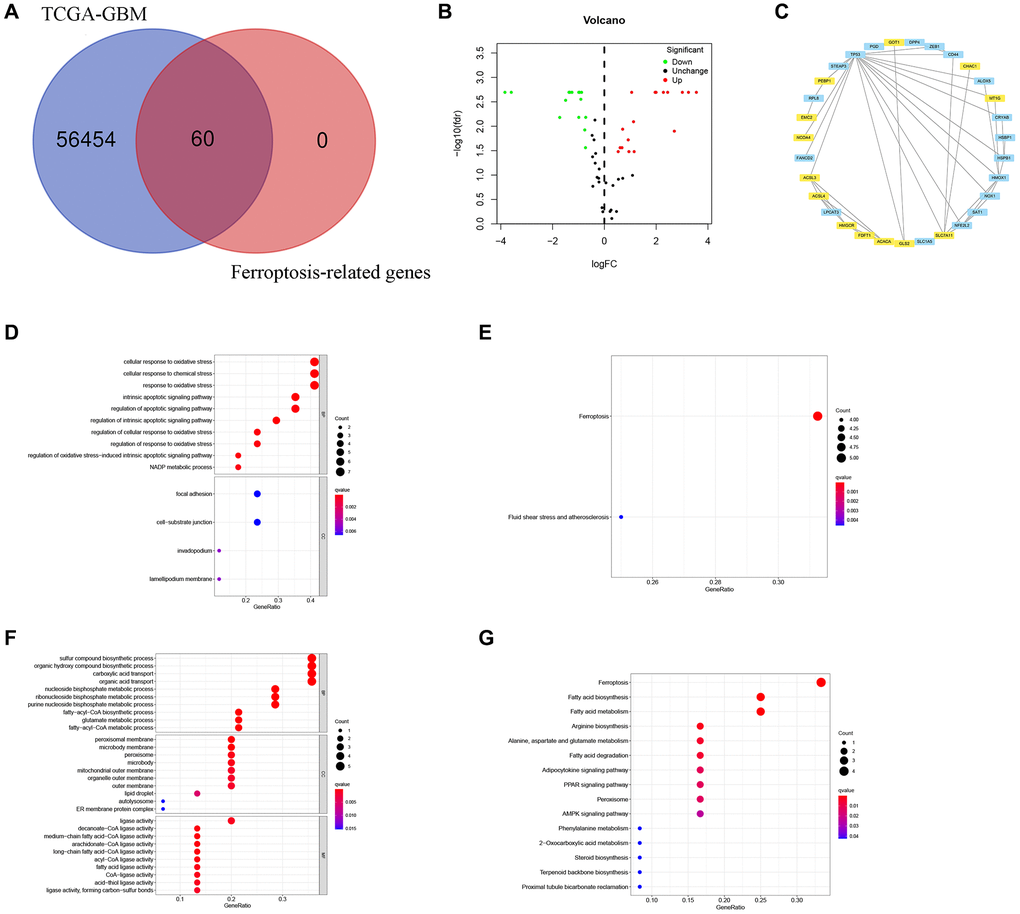
Figure 1.Identification of FRGs in GBM. (A) A Venn diagram indicating that 60 FRGs were identified in the TCGA-GBM cohorts. (B) Volcano plot showing DEGs among FRGs in GBM. (C) A PPI network on the relationship between up-regulated and down-regulated DEGs. Blue or yellow are up-or down-regulated DEGs, respectively. (D) GO analysis of up-regulated DEGs. (E) KEGG analysis of up-regulated DEGs. (F) GO analysis of down-regulated DEGs. (G) KEGG analysis of down-regulated DEGs.