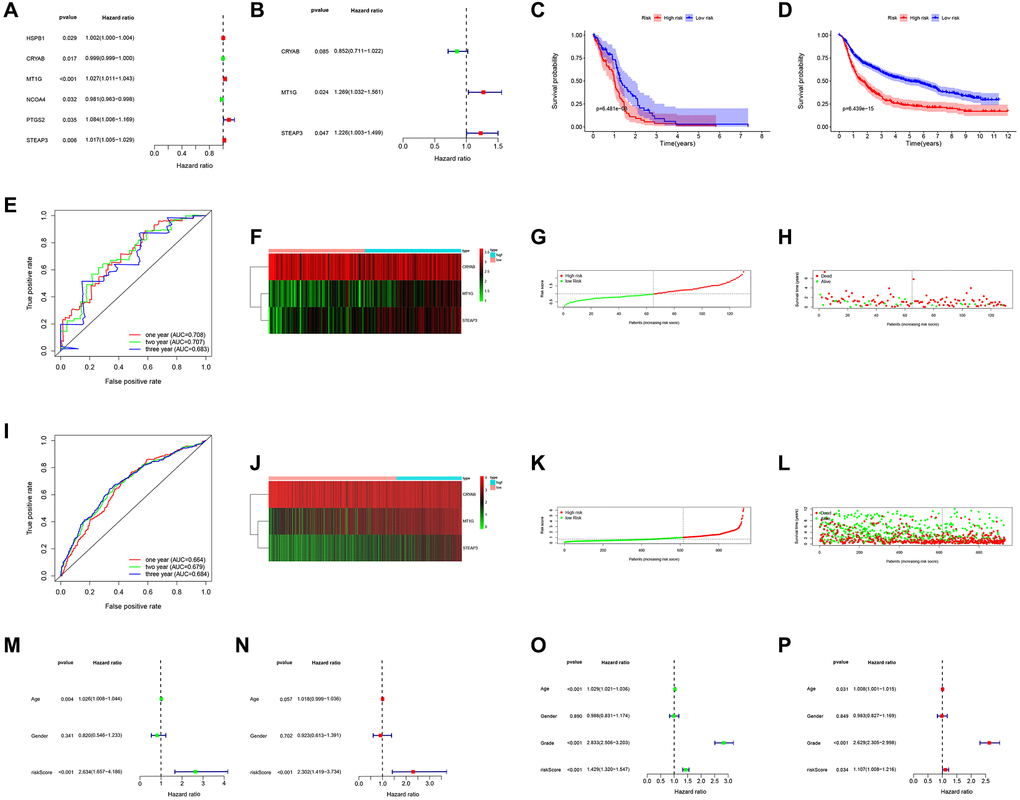
Figure 2.Prognostic significance of the FRGs signature derived risk scores. (A, B) Univariate and multivariate Cox analysis evaluating the prognostic-related genes in the TCGA (A) and CGGA cohort (B). The Kaplan-Meier survival curves for the high- and low-risk groups in TCGA (C) and CGGA cohort (D). (E, I) The predictive efficiency of the FRGs risk signature on the 1-, 3-, and 5-years survival rate in TCGA (E) and CGGA cohort (I) via ROC curve. (F, J) Heat maps of these three FRGs (CRYAB, MT1G, STEAP3) expression profiles in TCGA (F) and CGGA cohort (J). (G–I, K–L) Distribution of risk score and patient survival time, and status of GBM in TCGA (G, H) and CGGA cohort (K, L). The black dotted line is the optimal cut-off value for dividing patients into low-risk and high-risk groups. (M–P) Univariate and multivariate Cox analyses for evaluating the independent prognostic value of the FRGs signature in TCGA (M, N) and CGGA cohort (O, P).