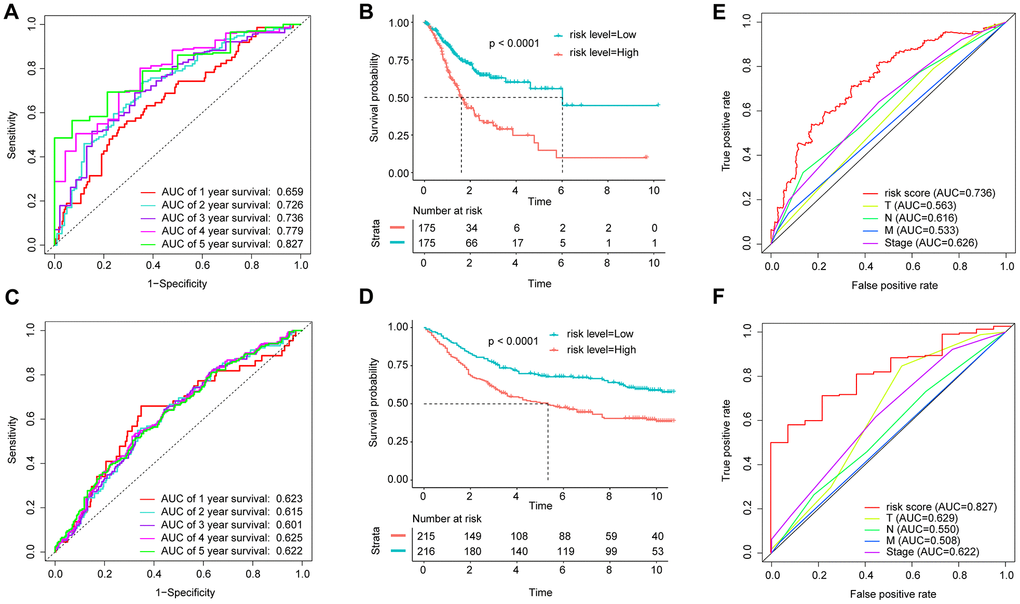
Figure 4.Application of the IBPS in predicting the survival of GAC patients. Kaplan-Meier survival curves of the hub RNAs in the ceRNA network. (A) ROC curve analysis of the immune-related gene signature for the prediction of OS at 1, 2, 3, 4, and 5 years in the TCGA cohort; (B) Kaplan-Meier curves of OS in all GAC patients in the TCGA cohort based on the risk score; (C) ROC curve analysis of the immune-related gene signature and TNM stage for the prediction of OS at 3 years in the TCGA cohort; (D) ROC curve analysis of the immune-related gene signature for the prediction of OS at 1, 2, 3, 4, and 5 years in the GEO cohort; (E) Kaplan-Meier curves of OS in all GAC patients in the GEO cohort based on the risk score; (F) ROC curve analysis of the immune-related gene signature and TNM stage for the prediction of OS at 5 years in the TCGA cohort.