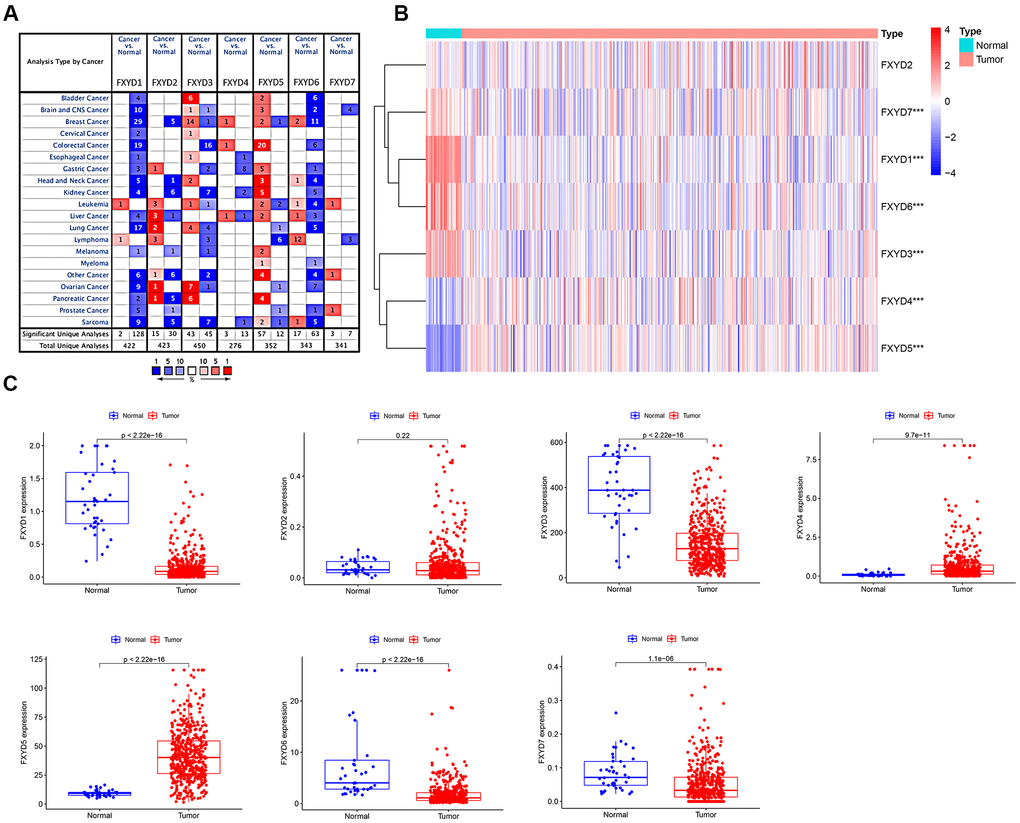
Figure 1.(A) The expression heatmap of FXYD family genes in different types of cancers. Red and blue indicate the numbers of datasets with statistically significant (P<0.05) increased and decreased levels of FXYD family members, respectively. (B) Differential expression of FXYD family genes between the CC samples and normal tissues represented by a heatmap. The tree diagram at the left showed the cluster analysis between FXYD family members. ***, P<0.001. (C) Differential expression of FXYD family genes between the CC samples and normal tissues represented by box plots.