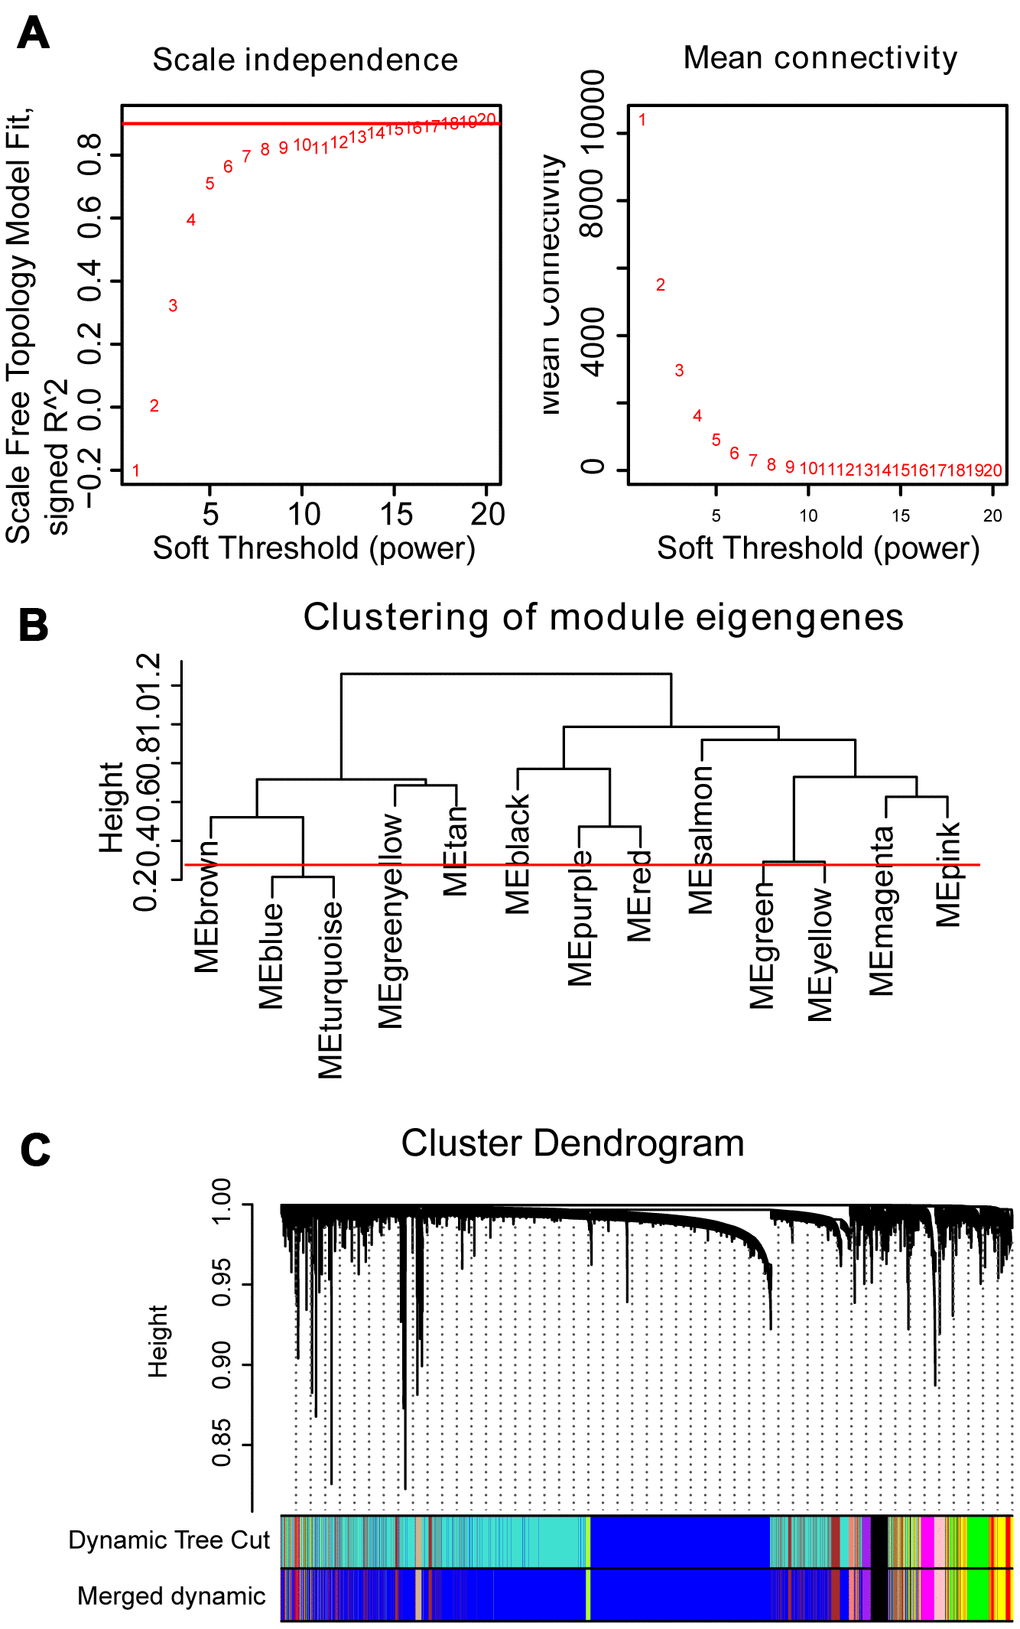
Figure 1.WGCNA constructs a gene network related to the status of MM. (A) Analysis of the scale-free fit index and mean connectivity for various soft-thresholding powers. The red line indicates the appropriate scale-free topology fit index at 0.9. The best β value was estimated at 0.9. (B) Dendrogram of consensus module eigengenes obtained by WGCNA on the consensus correlation. The red line at 0.25 indicates the merge threshold; groups of eigengenes below the threshold represent modules whose expression profiles were merged owing to their similarity. (C) Merged modules were identified by the Dynamic Tree Cutting method of WGCNA. Each module is assigned a color as an identifier. According to the correlation between the modules, twelve modules are generated after the merge.