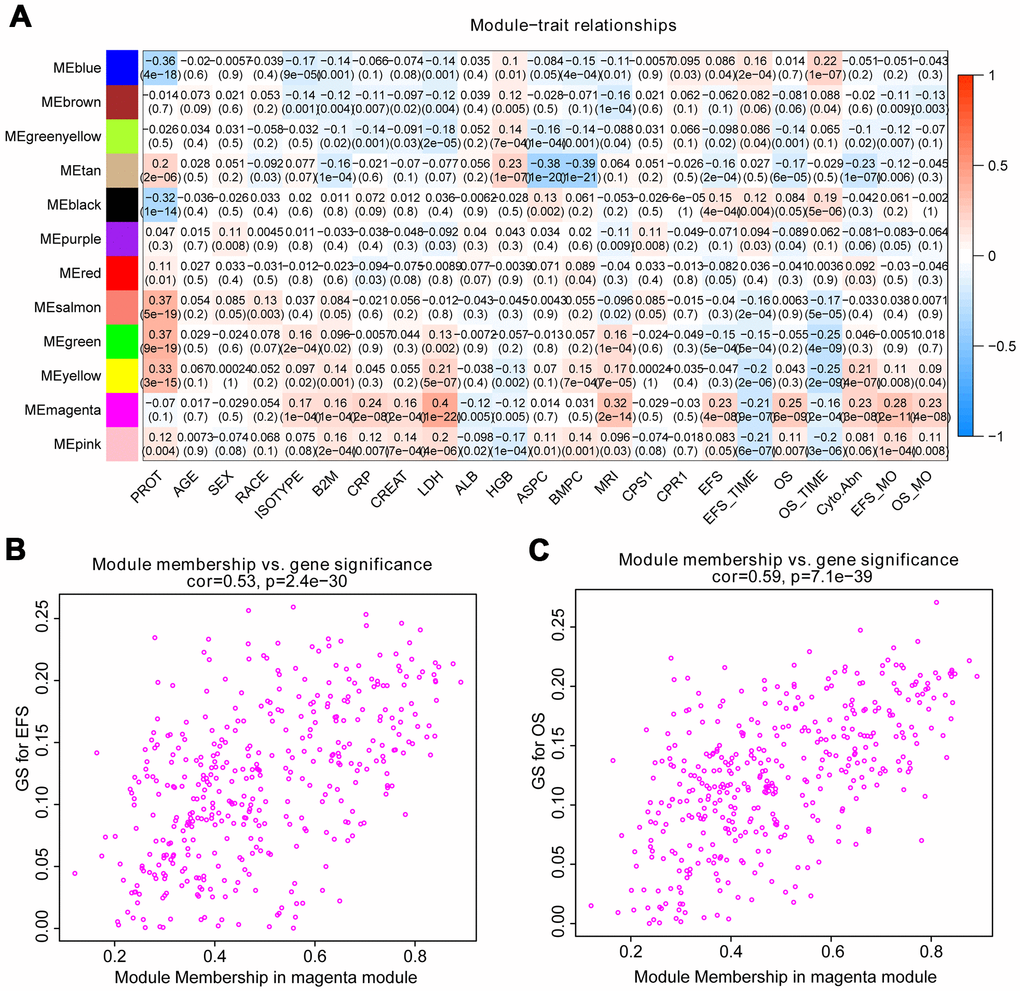
Figure 2.Identify modules related to the clinical features of MM. (A) Heat map of the correlation between module eigengenes and clinical traits of MM. Red means high adjacency and blue means low adjacency. The correlation coefficient and p-value were listed in the heat map. (B, C) Scatter plot of module eigengenes related to EFS and OS in the magenta module.