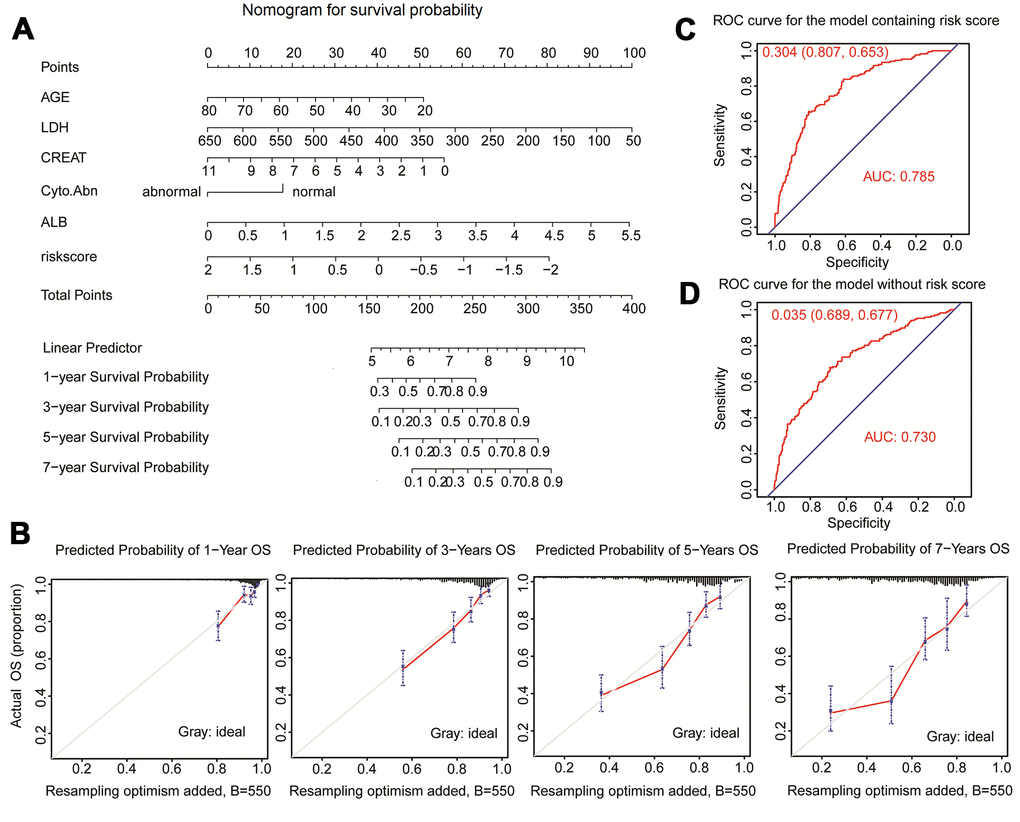
Figure 7.Nomogram predicting 1-year, 3-year, 5-year, and 7-year overall survival of multiple myeloma patients. (A) The nomogram consists of the fifteen-gene risk score and five clinical risk indicators. Add the points from these 6 variables together and find the location of the Total Points. The Total Points projected on the bottom scales indicate the probability of 1-year, 3-year, 5-year, and 7-year overall survival. (B) The calibration curve for predicting 1-year, 3-year, 5-year, and 7-year overall survival. (C) ROC curves for the nomogram model with risk score to predict patient survival. (D) ROC curves for the nomogram model without risk score to predict patient survival.