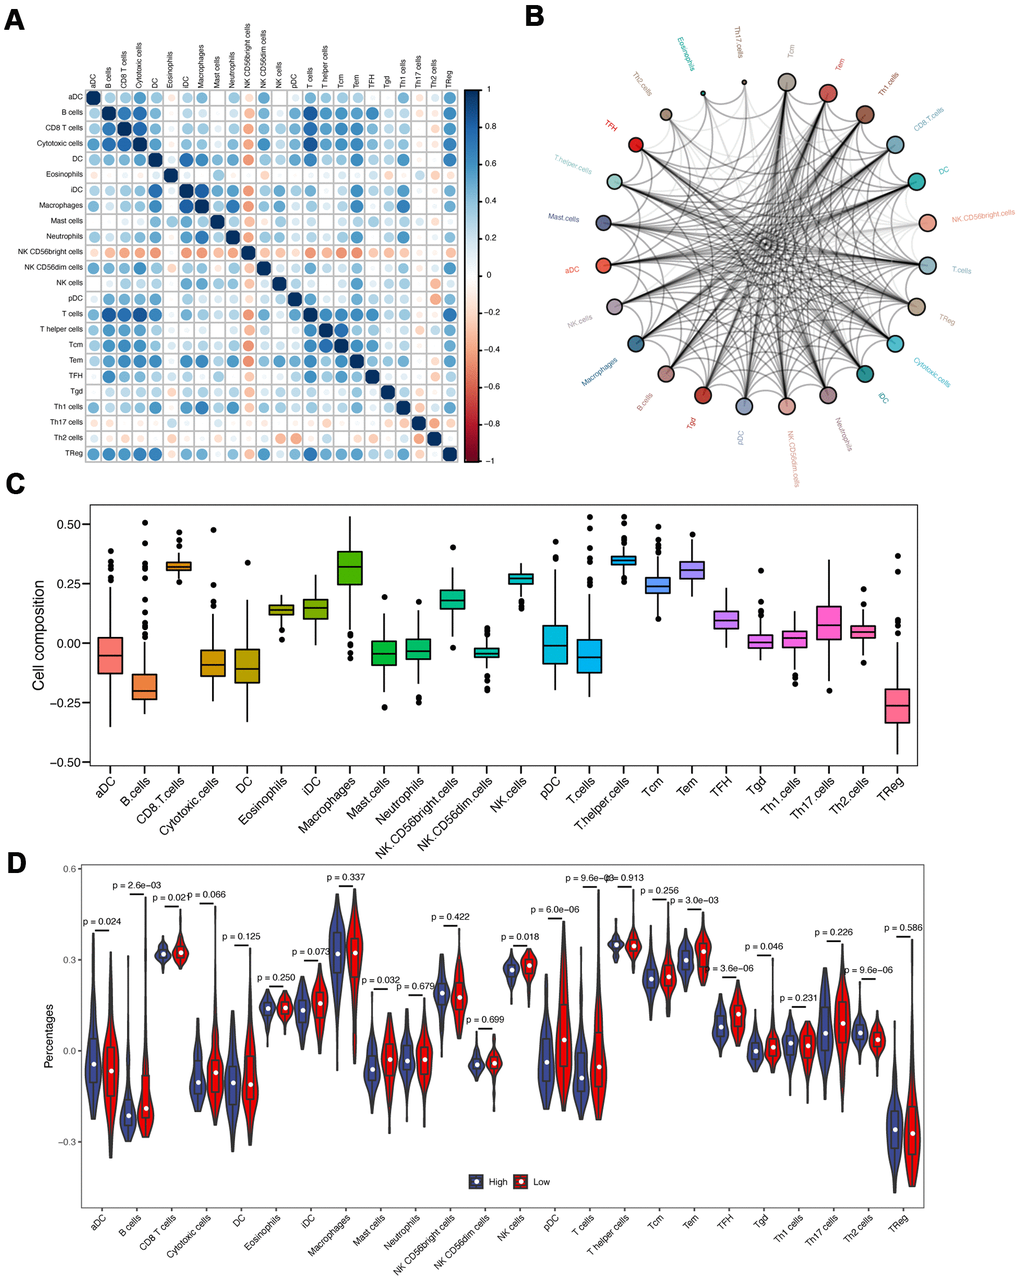
Figure 7.Immune infiltration analyses. (A) The correlation of different immune cells. (B) The immune cell interaction network. The big circle represented a strong interaction, and small one represented a weak interaction. (C) The composition analysis of immune cells in PAAD patients. The x-axis represents the type of immune cells, and the y-axis represents the proportion of immune cells. (D) The discrepancy of immune infiltration between high- and low-risk groups.