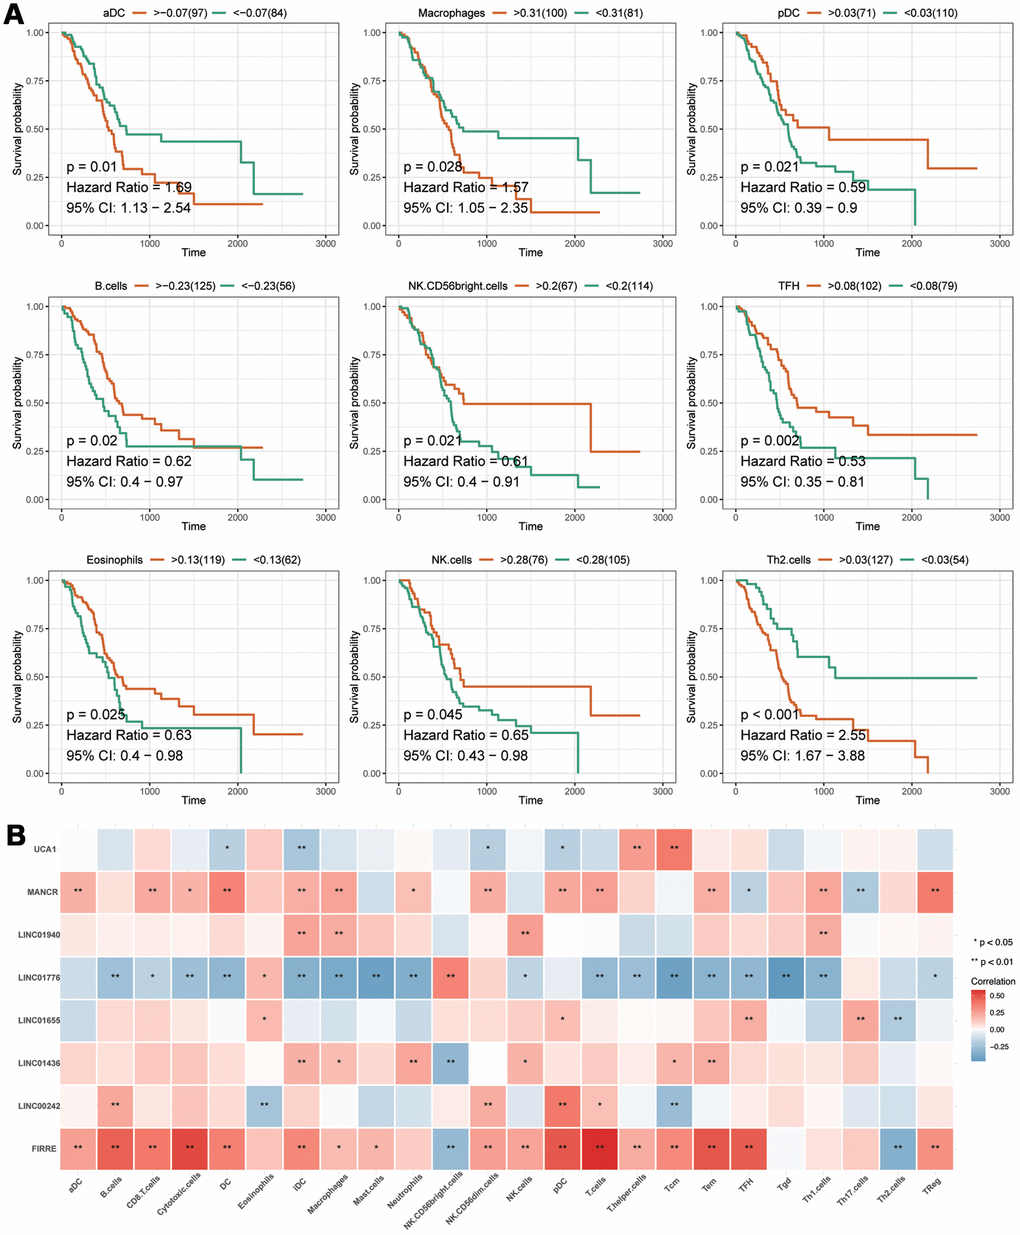
Figure 8.The analyses of immune cell. (A) The prognostic analysis of immune cells. The X-axis represents the survival time (day). Orange and green curve denote the high- and low-level groups, respectively. (B) The correlation of eight-IRlncRNA signature with immune cells. The X-axis represents the type of immune cells, and the Y-axis represents eight lncRNAs. Red means positive correlation, while blue means negative correlation. The darker color stands for a stronger correlation.