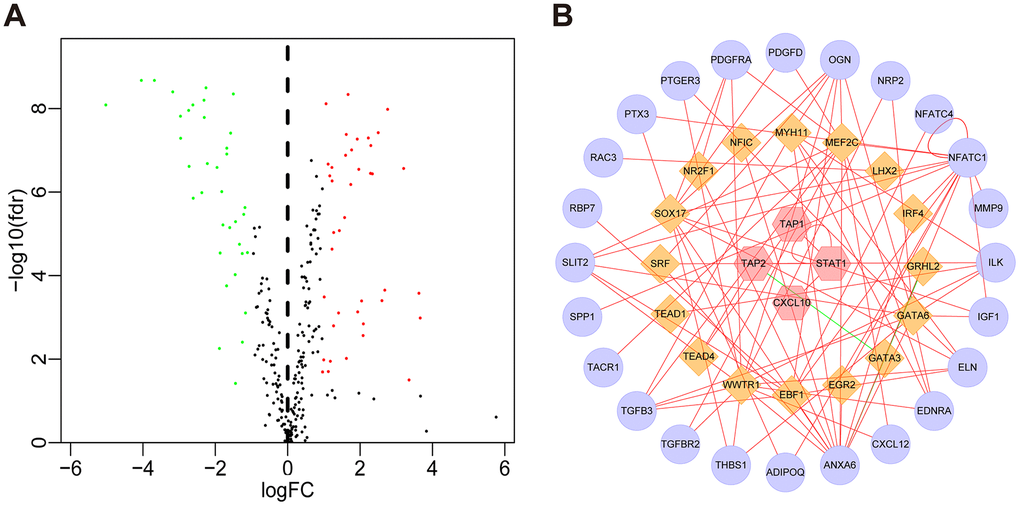
Figure 5.TF regulatory network. (A) Volcano plot of differentially expressed TFs. The green dots represent downregulated TFs, the red dots represent upregulated TFs, and the black dots represent TFs that were not significantly differentially expressed. (B) Regulatory network of TFs and IRGs; the yellow nodes represent TFs that correlated with the IRGs, the red nodes represent IRGs with hazard ratios < 1 (p < 0.05), the purple nodes represent IRGs with hazard ratios > 1 (p < 0.05) (correlation coefficient > 0.4 and p < 0.05), the green lines indicate negative regulatory relationships, and the red lines indicate positive regulatory relationships.