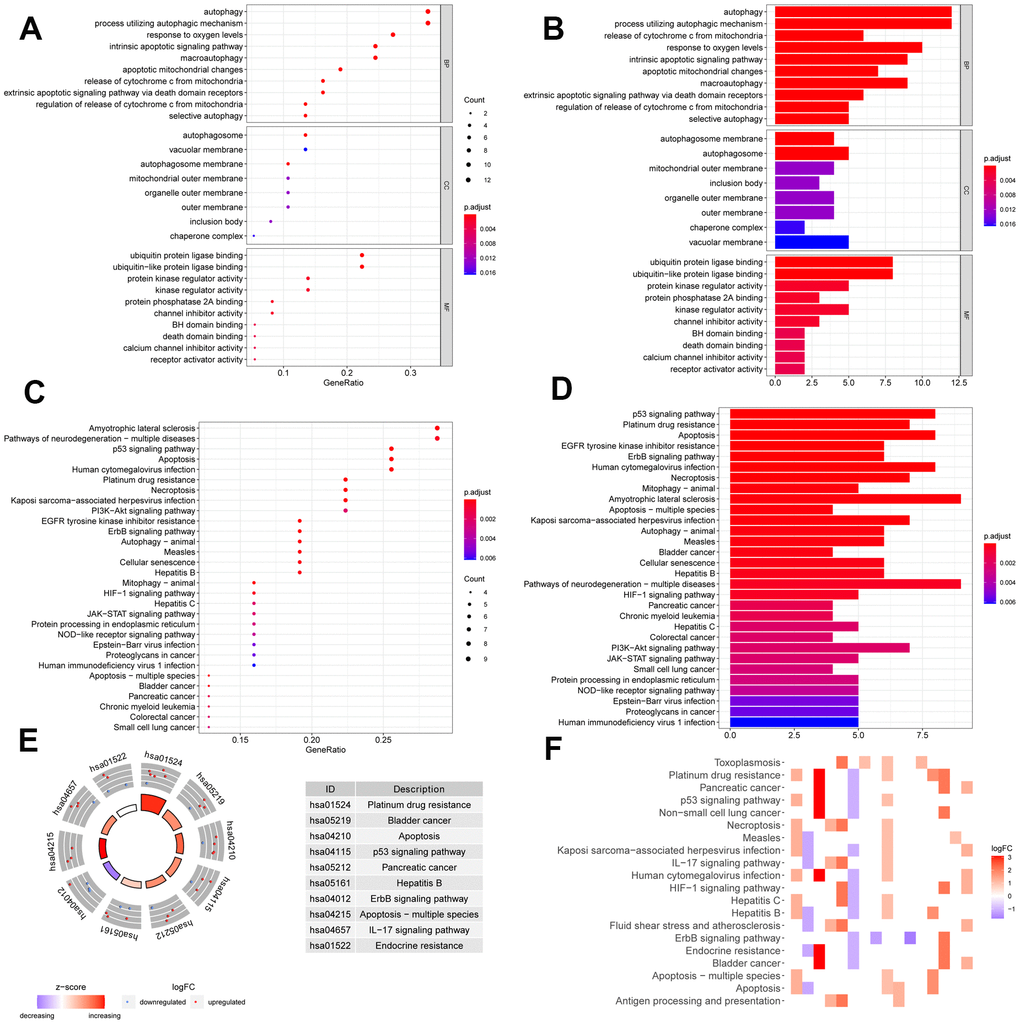
Figure 2.Function annotation of differentially expressed ARGs. Bubble chart (A) and histogram depiction (B) in the aspects of MF, BP, CC; bubble chart (C) and histogram depiction (D) of the top 30 enrichment pathways; (E) circle diagram of the top 10 significant enrichment pathways. The inner circle indicated Z-score. (F) The heatmaps of KEGG enrichment. The red color indicated the up- regulated genes and green represented down-regulated genes.