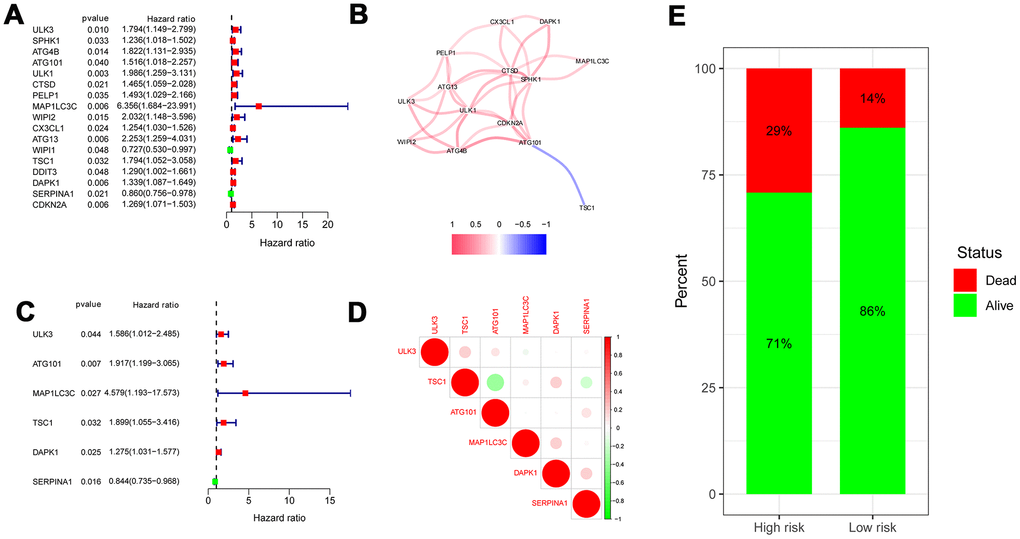
Figure 3.Risk ratio forest plot showed the prognostic value of the OS-related ARGs. (A) The forest plot of univariate Cox regression analysis. (B) The correlation network of OS-related ARGs. Correlation coefficients are represented by different colors. (red: positive correlations; blue: negative correlations). (C) The forest plot of multivariate Cox regression analysis. (D) Spearman correlation analysis of 6 hub genes in the TCGA databases. (E) Mortality rates of the low- and high- risk groups.