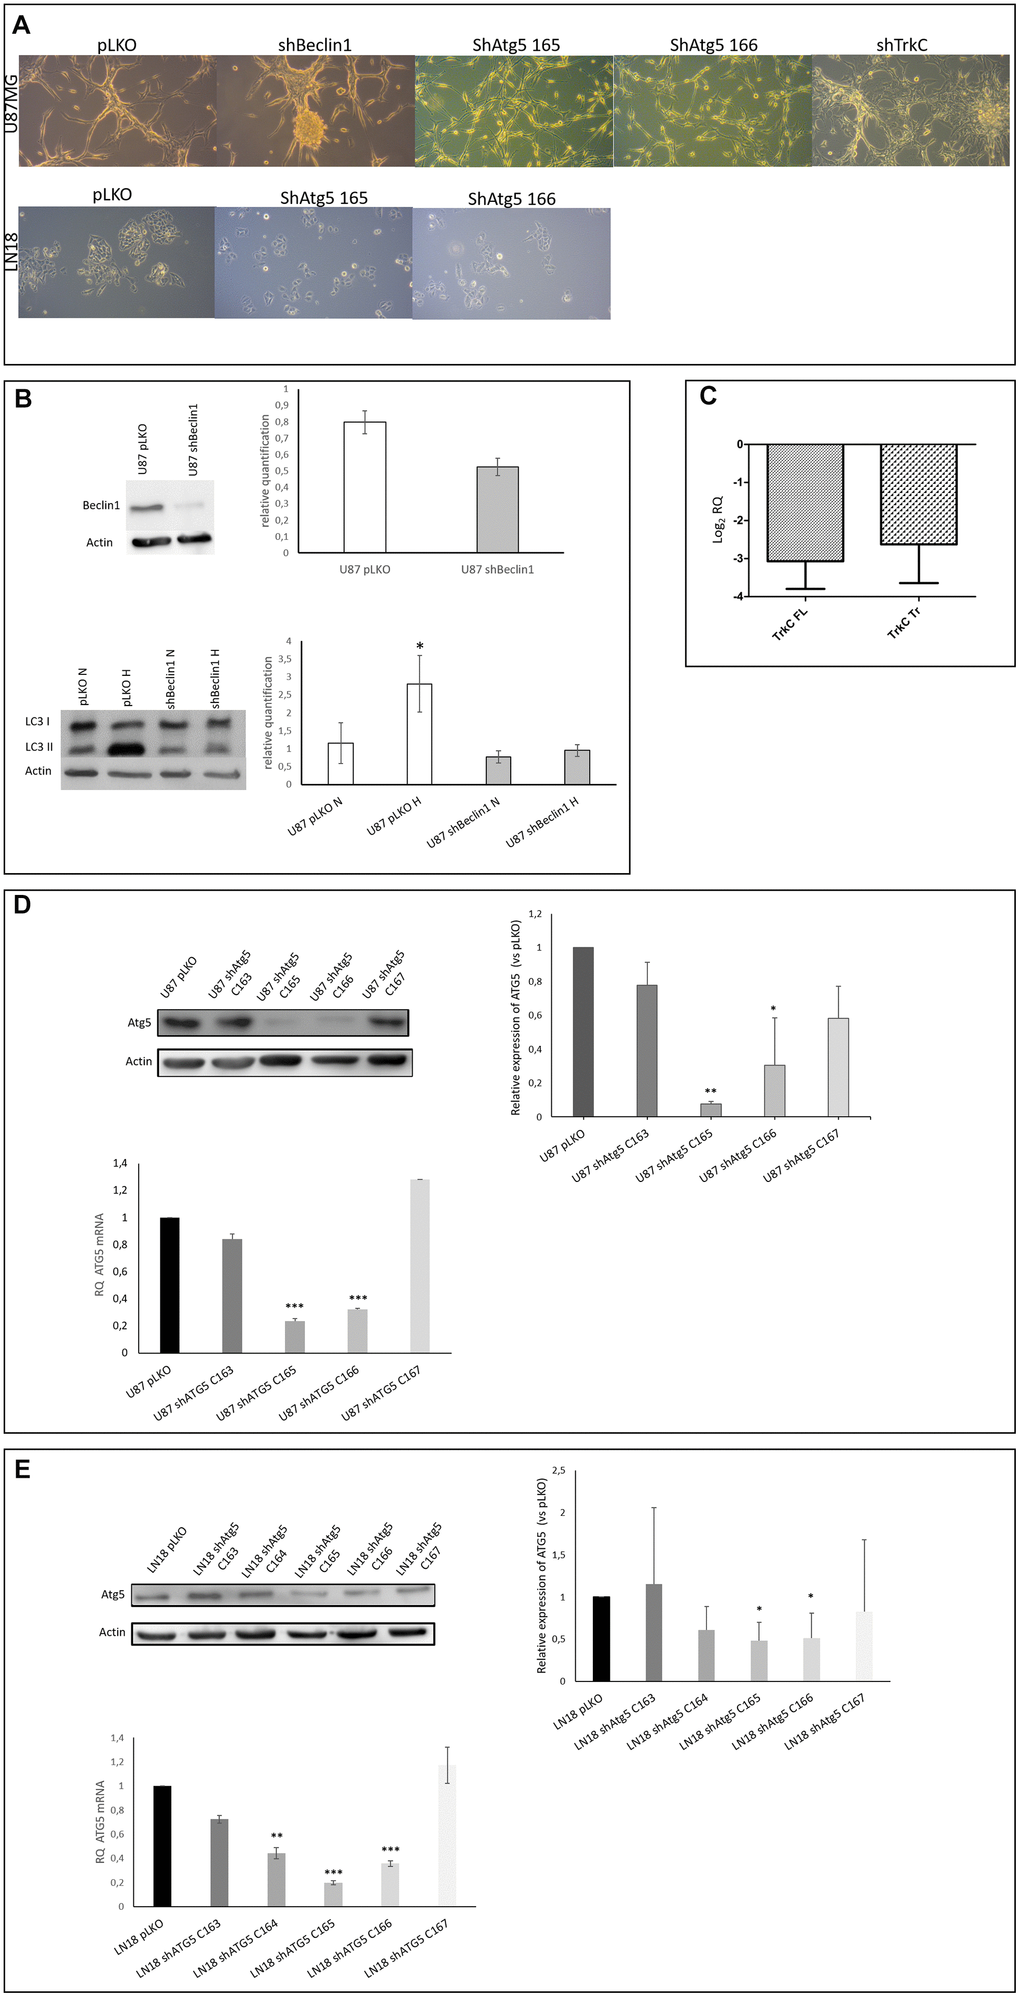
Figure 1.(A) Cell phenotype is modified in U87-MG but not in LN18 cells. U87-MG cells: U87shBeclin1 cells showed a high capacity to generate spheres as compared with U87pLKO cells (control cell line transfected with an empty vector). U87shATG5 cells (clones 165 and 166) appeared thinner and smaller than U87pLKO cells, without sphere formation. U87shTrkC cells appeared flattened, and larger than U87pLKO cells. LN18 cells: no difference was observed between LN18pLKO and LN18shATG5 cells, all cell lines presented attached cells, with a propensity to form clusters. (B) Reduced expression of Beclin1 leads to the inhibition of the autophagy process (N=3). Upper panel: Beclin1 protein expression is highly reduced in U87shBeclin1 cells showing a 60% of silencing in sh-cell line. Lower panel: LC3I to LC3II conversion (marker of functional autophagy) is evaluated by western blot analysis in U87pLKO and U87shBeclin1 cell lines when cultured in normoxic or hypoxic conditions. Increase of LC3II expression is observed in U87pLKO cells after hypoxic stress *p<0.05, whereas U87shBeclin1 cell line fails to exhibit such an increase. (C) Reduced expression of TrkC in U87shTrkC cells. TrkC expression was evaluated by RTqPCR. Biological activity of the TrkC receptor is due to two major isoforms of the TrkC protein after alternative splicing, named Full Length TrkC (145 kDa) and Truncated TrkC (95 KDa) (N=3). We verified that the TrkC-directed shRNA actually led to a drop in both TrkC mRNA levels (FL and Tr). In U87shTrKC both FL and Tr TrkC expressions, appear to decrease, with a log2 RQ value lower than -2.5 for each one of the transcripts (log2 RQ=0 corresponds to the expression level of TrkC in U87pLKO cells and was considered as a reference value). (D) Reduced expression of ATG5 in U87shATG5 cell lines (N=5). Upper panel: ATG5 protein expression was evaluated by western blot analysis in U87pLKO cells and in four U87shATG5 isolates. Clones U87shATG5-165 and -166 showed the strongest ATG5 expression decrease as compared with U87pLKO cells (**p<0.01 and *p<0.05 respectively). Bottom panel: the same evaluation was performed on ATG5 transcripts (RTqPCR) and gave similar results with the strongest decrease in ATG5 mRNA levels in clones U87shATG5-165 and -166 (*** p<0,001 for both clones). (E) Reduced expression of ATG5 in LN18shATG5 cell lines (N=5). Upper panel: ATG5 protein expression was evaluated by western blot analysis in LN18pLKO cell line and in four LN18shATG5 isolates. Clones LN18shATG5-165 and -166 showed the strongest ATG5 expression decrease as compared with LN18pLKO cells (*p<0.05 for both clones). Bottom panel: the same evaluation was performed on ATG5 transcripts (RTqPCR) in LN18 cell line and gave similar results with the strongest decrease in ATG5 mRNA levels in clones LN18shATG5-165 and -166 (*** p<0.001 for both clones).