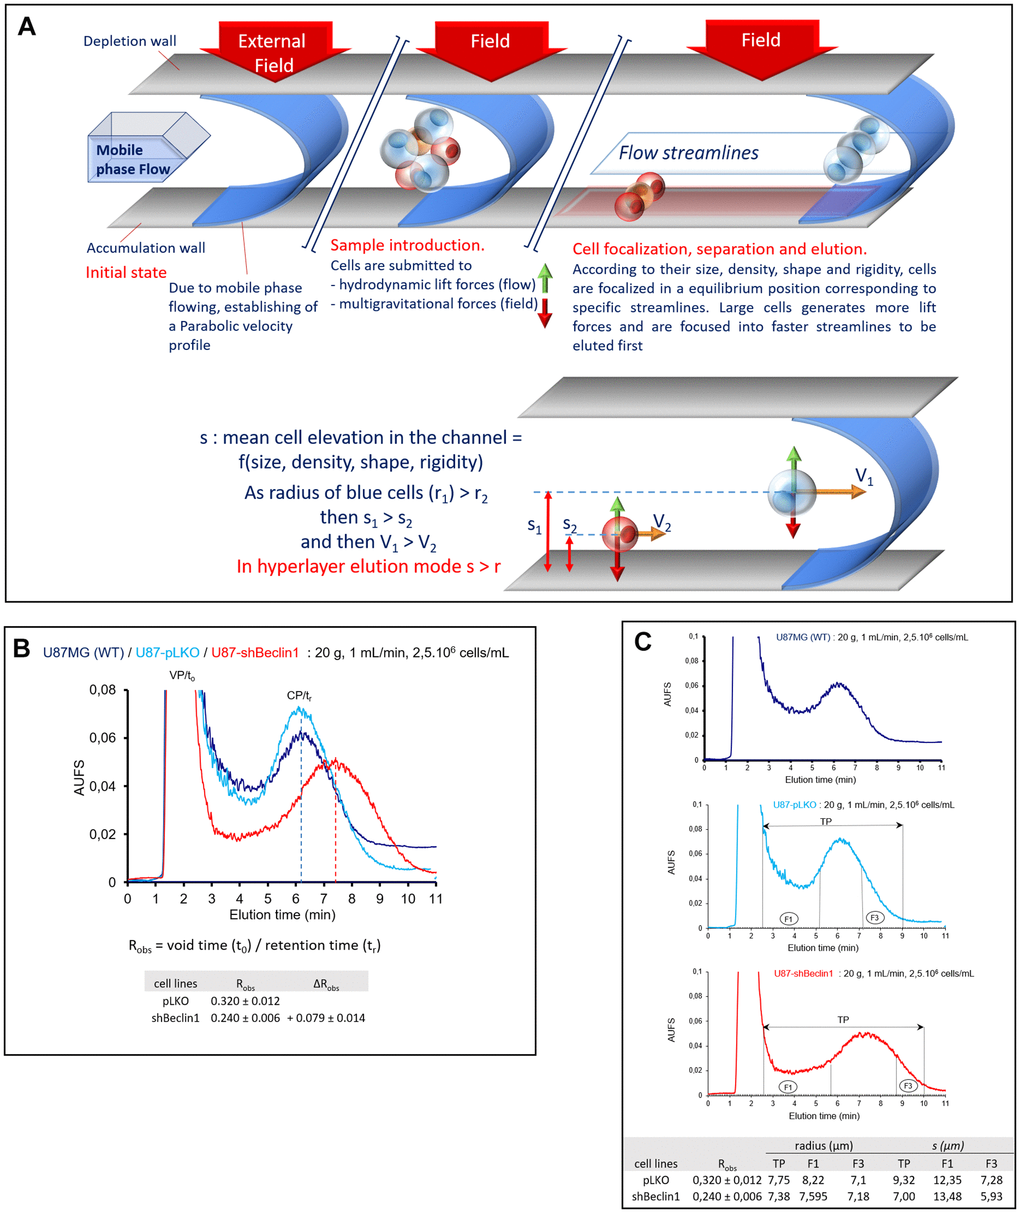
Figure 5.Cell monitoring and cell sorting by SdFFF. (A) A schematic representation of cell elution by sedimentation field-flow fractionation. Cells are eluted according to their biophysical properties (size, density, rigidity, deformability, nucleo-cytoplasmic ratio) under the biocompatible hyperlayer elution mode. Cell elution is characterized by the retention ratio: Robs = (retention time, tr)/void time, t0). Robs depends on cell elevation “s” in the channel thickness, ω. Larger and less dense cells are eluted first whereas smaller and denser ones are eluted later. (B) Comparison of representative fractograms. In each case, the classical two-peak profiles called fractograms were observed; the first peak corresponding to the void peak (VP, t0 unretained species) and the second one corresponding to the cell peak (CP, tr). Elution profiles (arbitrary absorbance units (AUFS) at 254 nm as a function of elution time) are similar for U87-MG (dark blue curve) and U87pLKO (light blue curve) cell lines. U87pLKO are used as control for SdFFF cell sorting. U87shBeclin1 fractogram (red curve) is around 1 minute right-shifted compared with U87pLKO. Robs = t0 / tr (void time / retention time), calculated by the first moment method, are used for the measurement of the peak shift: ∆Robs = Robs pLKO - Robs shBeclin1 = + 0.079 ± 0.014 (N=4). (C) Representative fraction collections. Elution profiles are similar for U87-MG (upper panel) and U87pLKO (mid panel) cell lines but different for U87shBeclin1 (lower panel). Representative collected fractions TP and F are indicated on fractograms by horizontal lines bounded by arrows and vertical plane lines, respectively: TP: 2’30-9’00, F1: 2’30-5’10 and F3: 7’10-9’00 for U87pLKO; TP: 2’30-10’00, F1: 2’30-5’40 and F3: 8’45-10’00 for U87shBeclin1. Cells eluted in the fraction 1 (F1) are larger than those eluted in the last one (F3). "s" considered as the average cell elevation in the channel thickness is larger than the particle radius of U87pLKO cells, contrary to U87shBeclin1, especially cells collected in F3 shBeclin1(N=4).