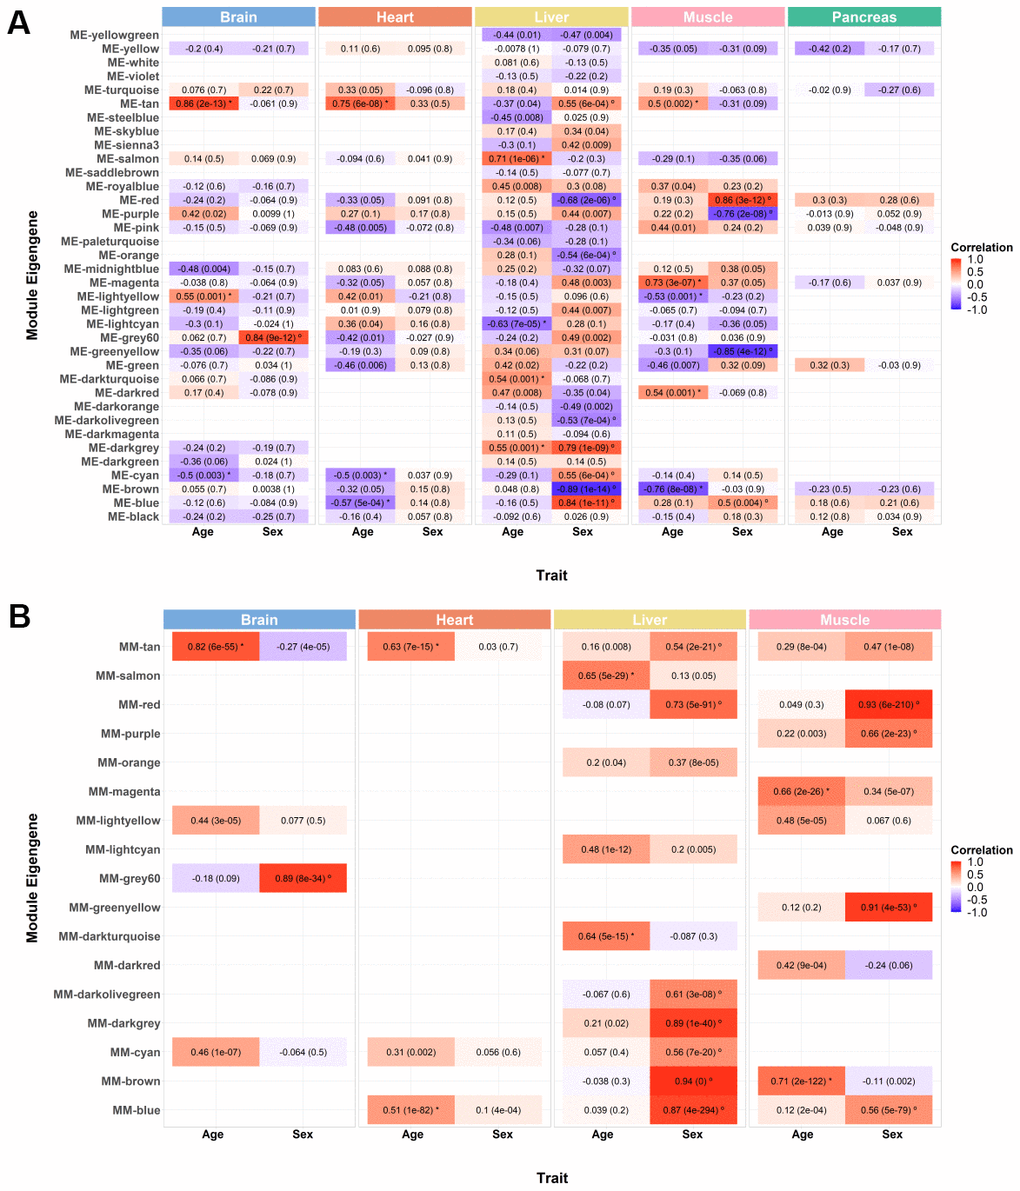
Figure 2.Weighted gene co-expression network module selection. (A) Correlation between each module’s eigengene (ME) with age and sex. Each tissue exhibits a variable number of modules of co-expressed genes (brain: 24; heart: 19; liver: 36; muscle: 21; pancreas: 10), and unassigned genes are clustered together in the grey module (not shown). ME is the first principal component of the expression matrix of a module, thus being the most representative gene expression profile of that group of correlated genes. Cells are annotated with bicor values and corresponding FDR adjusted p-values (inside brackets). Red and blue cells depict positive and negative correlations, respectively. The intensity of color represents the degree of correlation. All modules whose ME’s correlation with the trait of interest is significantly equal or higher than 0.5 were considered (moderate correlation and above; FDR < 0.05; significant correlations with age marked with * and significant correlations with sex marked with º). (B) Correlation between module membership (MM) and gene significance (GS) of the previously selected significant modules. MM is obtained by correlating the expression of individual genes to the ME, and GS corresponds to the absolute value of the correlation between individual genes and the trait of interest. Only modules with moderate or higher (≥ 0.5) and significant (p-value < 0.05) correlations with age and sex were considered for subsequent analysis (marked with * and º, respectively).