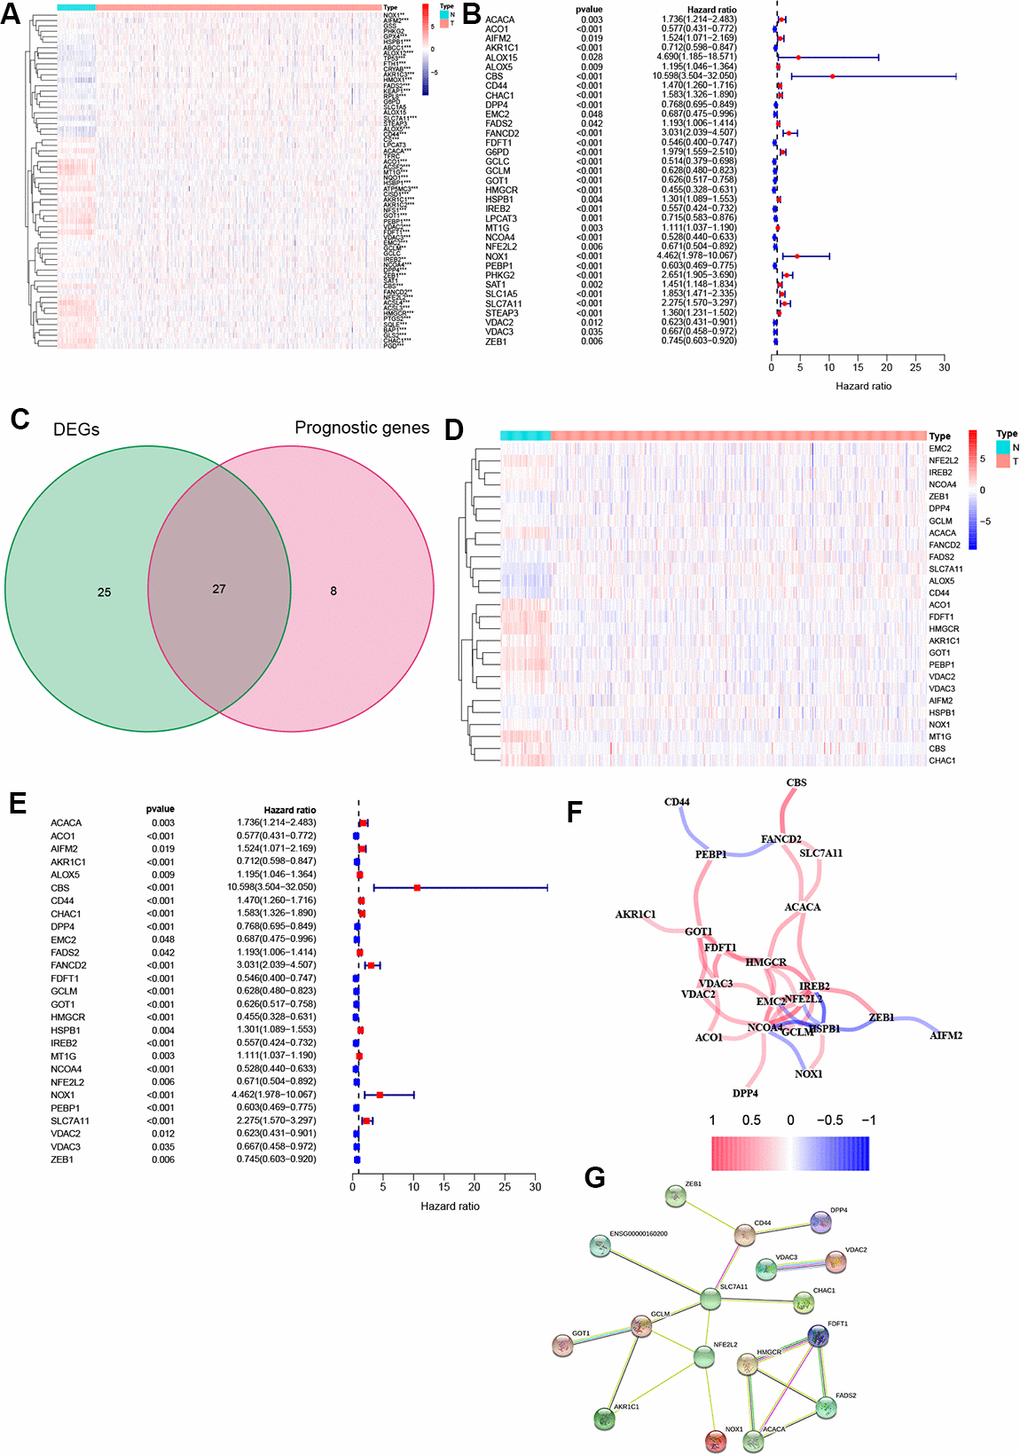
Figure 1.Identification of FRGs. (A) 52 genes showed significant differences in expression in ccRCC tissue. (B) 35 of the DEGs were associated with OS in univariate Cox analysis. (C) Venn plot to identify prognostic DEGs. (D) 27 overlapping genes show significantly different levels of expression in ccRCC tissues. (E) Forest plot displaying result of univariate Cox analysis between prognostic DEGS and OS. (F) The correlation network of prognostic DEGs. (G) The PPI network from the STRING database. *, P < 0.05; **, P < 0.01; ***, P < 0.001.