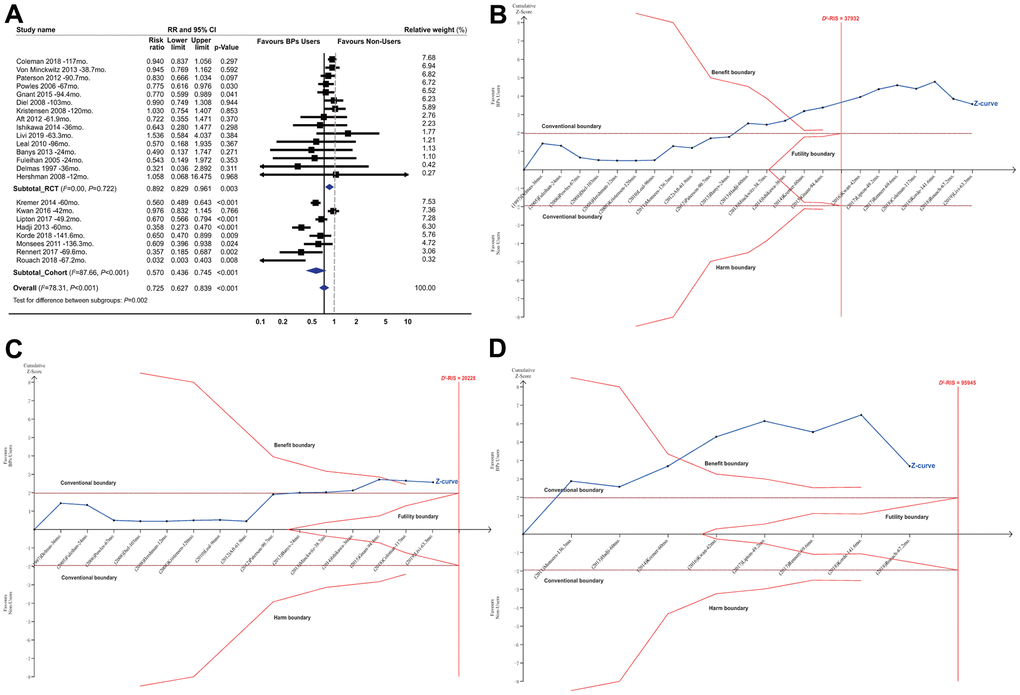
Figure 1.Summarized results of bisphosphonates on breast cancer survival. (A) Conventional meta-analysis by study design*; (B) Trial sequential analysis combining RCTs and cohorts†; (C) Trial sequential analysis for RCTs; (D) Trial sequential analysis for cohort studies. Abbreviations: BPs, bisphosphonates; CI, confidence interval; D2-RIS, the diversity adjusted required information size in trial sequential analysis; mo., months; RCTs, randomized controlled trials; RR, risk ratio; the black square represents effect size of each study; the blue diamond represents the summarized effect sizes. *Studies were ordered based on their relative weight. †The solid red vertical line represents the diversity adjusted required information size (D2-RIS). The solid red outer curves (trial sequential monitoring boundaries for benefit or harm) represent the sequential analysis thresholds for statistical significance. The solid red inner wedge curves inside the horizontal dotted brown lines represent the futility boundaries. The horizontal dotted brown lines represent the conventional thresholds for statistical significance at a constant z value of 1.96, which corresponds to a two-sided P-value of 0.05. The solid blue line is the cumulative z curve and represents the accumulating amount of information as studies are added, each square denoting an individual study. If the cumulative z curve crosses the D2-RIS line, it represents that the D2-RIS has been currently accrued. If the cumulative z curve crosses the benefit or harm boundary, it represents conclusive evidence in favour of bisphosphonate users or non-users respectively. If the cumulative z curve crosses the futility boundaries, then it would be extremely unlikely that the addition of future studies would demonstrate any significant effect. In the panel B (combining RCTs and cohort studies), the actually cumulative sample size in this analysis has currently excessed the D2-RIS and the cumulative z curve crossed the benefit boundary. In the panels of C and D (for RCTs and cohort studies respectively), the D2-RIS has not been reached but the cumulative z curve crossed the benefit boundary for both RCTs and cohort studies.