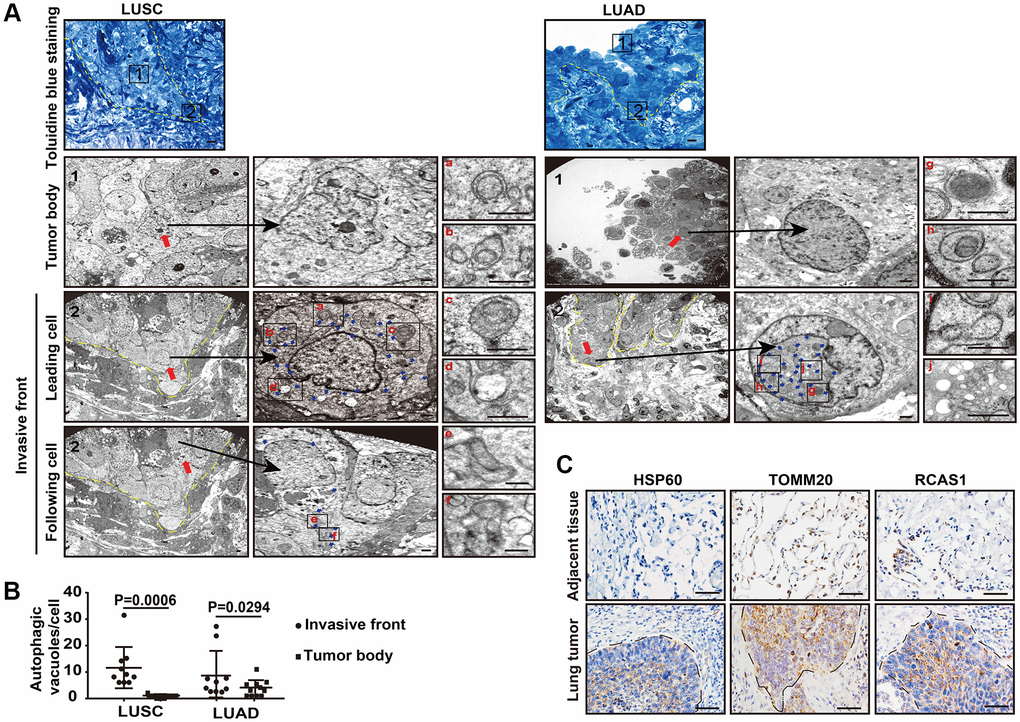
Figure 1.The autophagic flux is increased at the tumor invasive front. (A) Toluidine blue staining of the LUSC and LUAD for TEM (left panel). The TEM images show the autophagic vacuoles (blue arrows) in tumor cells located at the invasive front and inside the tumor body of LUSC and LUAD (right panel). Dashed line, tumor-stroma border. Red arrows, leader cells and following cells in invasive front and cells inside the tumor body. The enlarged images show autophagic vacuoles, including phagophores (a and g), autophagosomes (b and h), amphisomes (c, e, f and i) and autolysosomes (d and j). Scale bars, 50 μm for toluidine blue staining and 1 μm for TEM. (B) The quantification of the autophagic vacuoles per cell located at the tumor invasive front and inside the tumor body (P = 0.0006 in LUSC, P = 0.0294 in LUAD). Error bars, means ± SEM for 10 cells in a representative experiment. (C) Representative immunohistochemistry (IHC) images of HSP60, TOMM20 and RSCA1 in LUSC specimens and tumor-adjacent tissues. Scale bars, 50 μm.