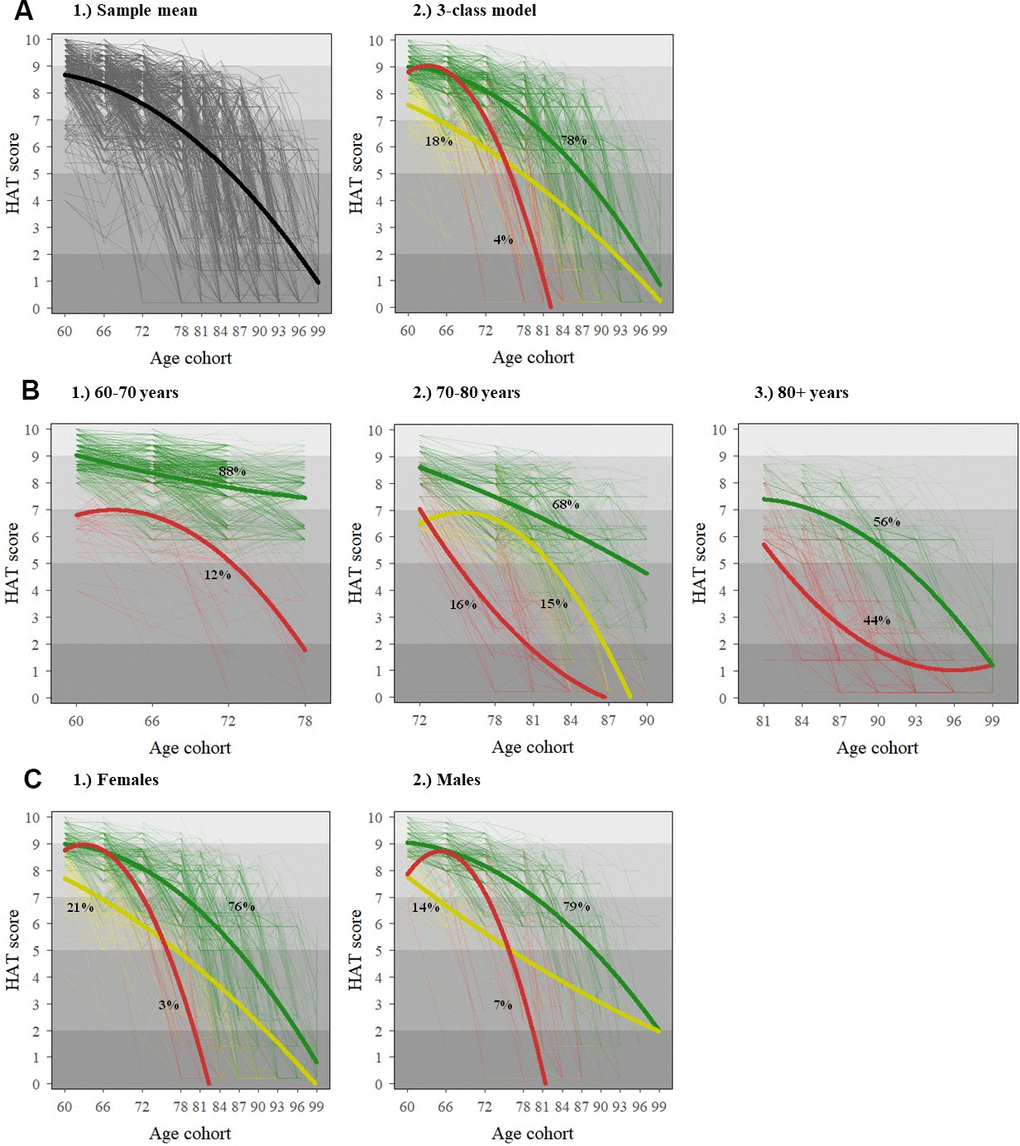
Figure 1.Individual (dotted) and average (solid) HAT-score trajectories for the general population (A) and stratified by baseline age (B) and sex (C). The x-axis in all graphs reflects the age structure of SNAC-K, whereby participants belong to any of the following 11 age cohorts (aged 60, 66, 72, 78, 81, 84, 87, 90, 93, 96 and 99+) both at baseline and at follow-ups. The shading in the background of the graphs reflects the clinical interpretation of HAT scores, as described in Table 1.