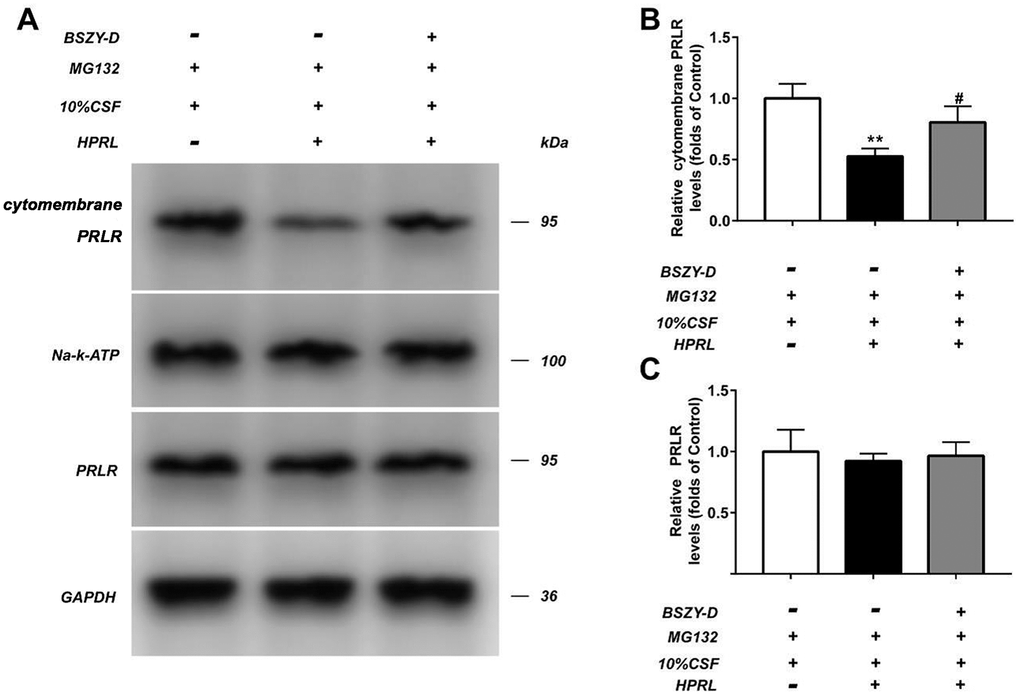
Figure 3.The level of PRLR in GT1-7 from different groups was detected by western blot assay, and representative bands were shown in (A). The levels of PRLR (B, C) were normalized to control. The results were presented as mean ± SD (n = 3). **p < 0.01 vs. Control group, #p < 0.05, ##p < 0.01 vs. HPRL group.