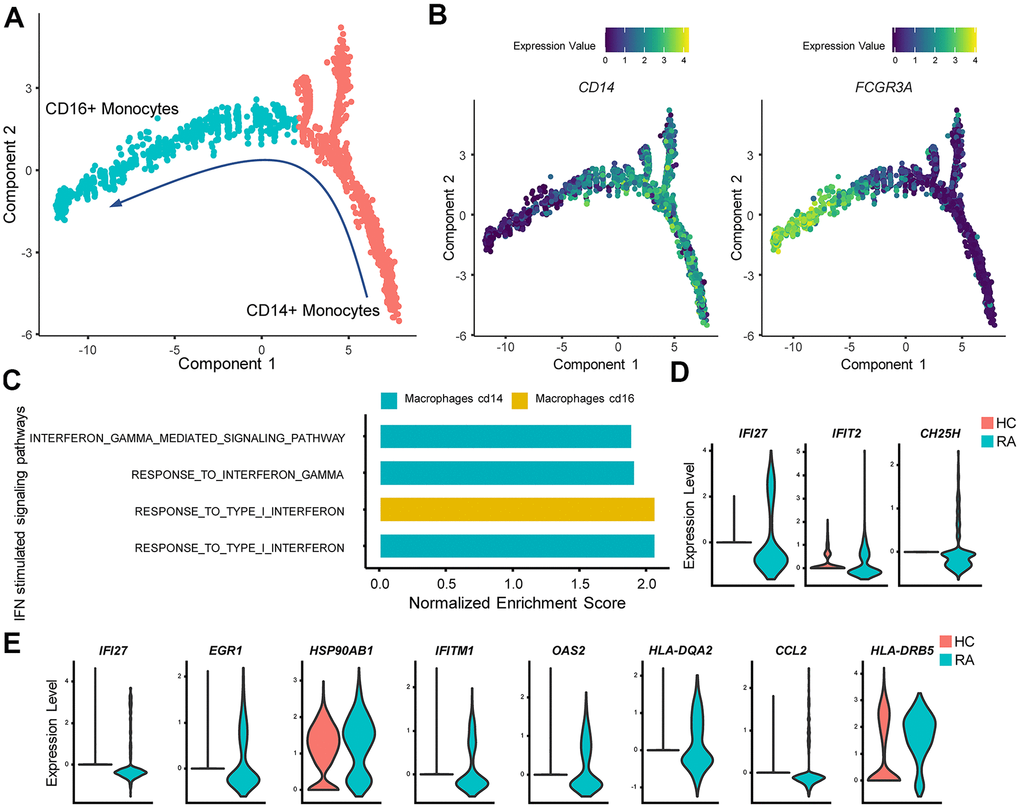
Figure 4.IFN promotes rheumatoid arthritis (RA) monocyte inflammatory responses. (A) Red and cyan points indicate CD14+ monocytes and CD16+ monocytes, respectively. The direction of arrows indicates the direction of the pseudotime. (B) Trajectory plots of monocytes indicating the expression levels of CD14 and FCGR3A (CD16a) in monocytes. (C) Bar plots of selected gene set enrichment analysis (GSEA) results indicate activated IFN signaling pathways in CD14+ and CD16+ monocytes. (D) Violin plots of significantly upregulated type I IFN-stimulated genes (IFI27, IFIT2) and upregulated proinflammatory gene (CH25H) in RA CD16+ monocytes. (E) Violin plots of significantly upregulated IFN-γ-stimulated genes (IFI27, EGR1, HSP90AB1, IFITM1, OAS2, HLA-DQA2, CCL2) and upregulated proinflammatory genes (HLA-DRB5) in RA CD14+ monocytes. All upregulated genes satisfied log2 (fold change)>0.25 and adjusted p value<0.05.